
Figures & data
Figure 1. Drainage map of Yitong River and location of sampling reaches.
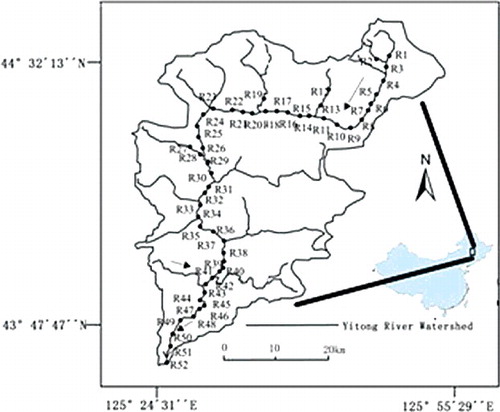
Table 1. Basic hydrological data of Yitong River.
Table 2. Pearson correlation matrix between metrics of Habitat Quality Assessment (HQA) and Habitat Modification Score (HMS).
Table 3. Pearson correlation matrix between metrics of Habitat Modification Score (HMS).
Table 4. Principal components of assessment categories of Habitat Quality Assessment (HQA) and Habitat Modification Score (HMS).
Figure 2. Satellite map of Yitong River basin.
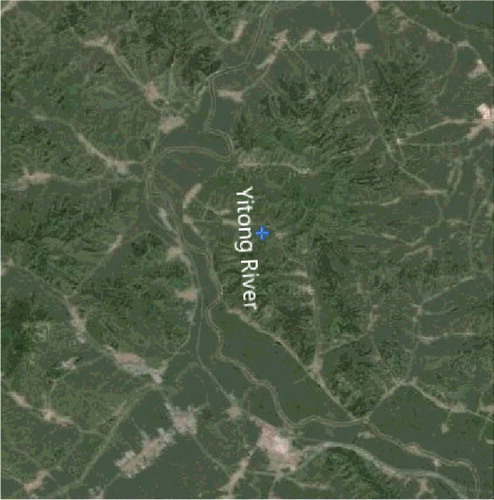
Figure 3. Linear regressions between Habitat Quality Assessment (HQA) and Habitat Modification Score (HMS).
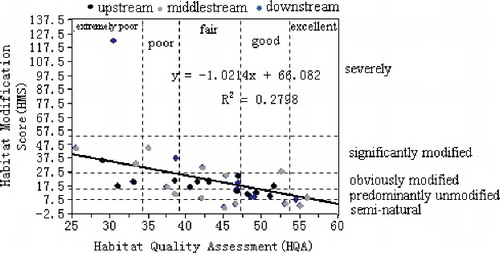
Table 5. Habitat Quality Assessment (HQA) and Habitat Modification Score (HMS) of sampling reaches in upstream, midstream and downstream of Yitong River.