Figures & data
Table 1. Distribution of white perch ages collected monthly from Sooner Lake, Oklahoma during 2015–2016.
Figure 1. Mean marginal increment measurement by month from white perch otoliths for (A) age 1, (B) ages 2–3, (C) ages 4–5, (D) ages 6–8, and (E) pooled ages. Error bars represent the standard error of the mean.
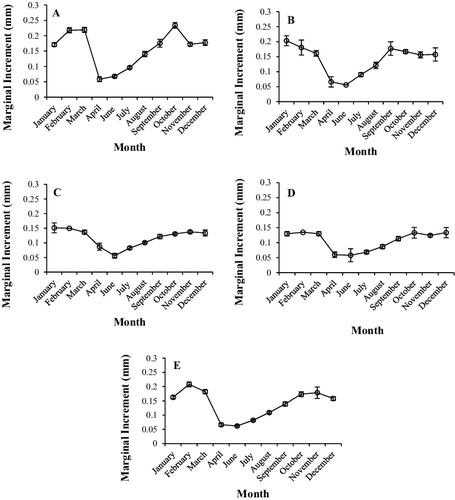
Figure 2. Length-frequency distribution (by 10 mm TL increments) of white perch collected from Sooner Lake, Oklahoma during 2015–2016.
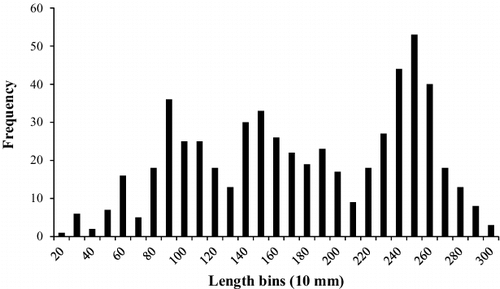
Table 2. Proportional size distribution (PSD) and mean relative weight (Wr; standard deviation) by length categories, and length–weight relationship for white perch collected from Sooner Lake, Oklahoma during 2015–2016.
Figure 3. Von Bertalanffy growth curve calculated from otolith age estimates for white perch collected from Sooner Lake, Oklahoma during 2015–2016.
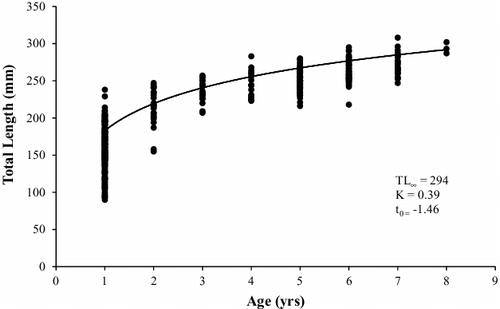
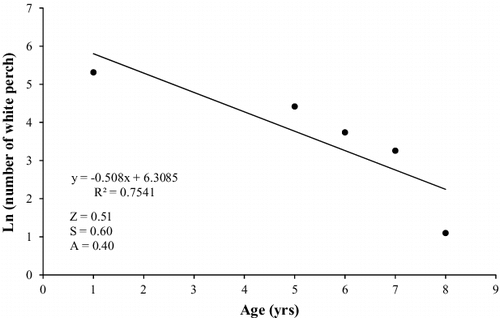
Figure 4. Catch-curve regression and total annual mortality (A) for white perch collected from Sooner Lake, Oklahoma during 2015–2016.