
Figures & data
Figure 1. Box plots showing the distribution of body color for individual brook trout as they appeared over light sand and darker rock substrates. The mean body color for the individuals over sand was 1.76, which was significantly lighter than when presiding over rocks, with a mean of 3.30. The color intensity scale ranged from the lightest shade (1) to the darkest shade (5) found in the substrate used for experimentation. Middle values were interpolated from the end members using Photoshop (Adobe Systems, Inc.).
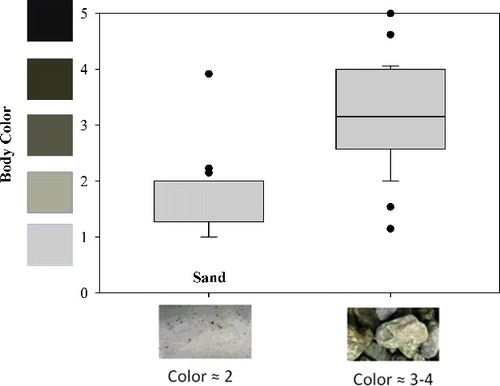
Figure 2. Box plots illustrating the average percent time for each individual brook trout in trials with both light and dark substrates available. (A) Trials conducted with light sand and dark rock; (B) trials conducted with light and dark rocks.
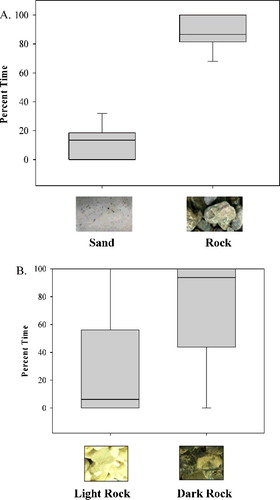
Figure 3. Picture depicting the social hierarchy present in brook trout. The dominant fish pictured on the right is lightly colored and better matching the predominantly sandy substrate than subordinate fish displaying a dark body and seeking refuge near hiding cover (Photo credit: Kyle Snow).
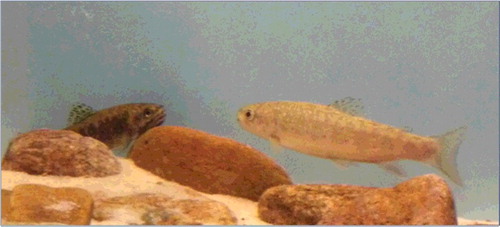
Table 1. Pooled means (and standard deviations) of body color for dominant and subordinate fish during individual (n = 8) and paired trials (n = 4) over lightly colored sand.