Figures & data
Figure 1. Maps of research sites. A shows the location of both ponds and the main vegetation types in the watershed. B shows the depth profile of the woodland pond. C shows the depth profile of the prairie pond in May when the pond was full. D shows the change in surface area of the prairie pond as the prairie pond dried and refilled.
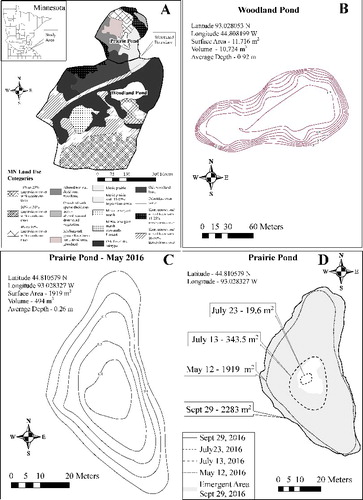
Table 1. Physical and chemical parameters of the study sites.
Figure 2. Seasonal variation in mean daily water temperature, photosynthetic active radiation, light intensity at 10 cm below the water surface and change in water level since the beginning of the study for the prairie and woodland ponds. The daily rainfall for the area is also given. Lines are cubic spline fits to show the pattern of change.
Figure 3. Mean rate of daily periphyton production, measured as chlorophyll a, from the woodland and prairie ponds. Vertical bars are 1 standard deviation. Rates were determined over two week periods from August 5 to November 3. The influence of nutrient control on production was measured by adding nitrogen, phosphorus or nitrogen + phosphorus.
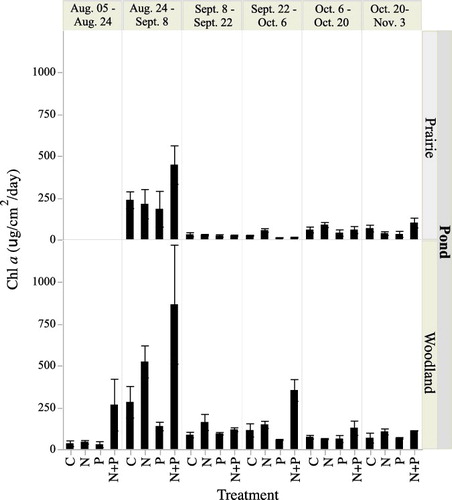
Figure 4. Mean standing crop biomass, as chlorophyll a, of phytoplankton from the prairie and woodland ponds. Lines are cubic spline fits to show the pattern of change. Measurements were made from June 8 to November 3.
Figure 5. Relationships between mean daily water temperature and photosynthetically active radiation (PAR) and phytoplankton biomass. Lines are from the ANCOVA analysis and shaded areas are 95% confidence limits for the trend lines.
Figure 6. Oxygen saturation levels for the prairie and woodland ponds from May 21 to November 2. Days of missing data in July in the prairie pond are times when the pond level fell below the level of the oxygen probes.
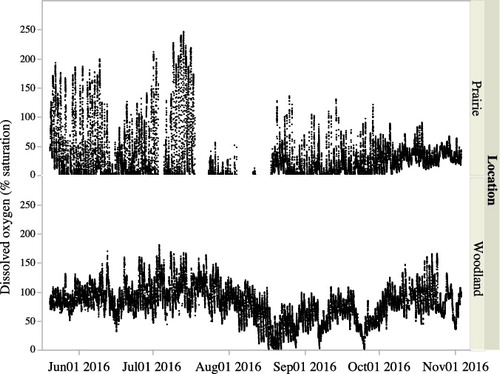
Figure 7. Daily rates of gross primary production (GPP), respiration (R) and net ecosystem production (NEP) for the prairie and woodland ponds from May 21 to November 2. Lines are cubic spline fits to show the pattern of change.
Figure 8. Relationships between mean daily water temperature, photosynthetically active radiation (PAR) and changes in water level since the beginning of the study and gross primary production (GPP) and respiration (R). Lines are from the ANCOVA analysis and shaded areas are 95% confidence limits for the trend lines.