Figures & data
Figure 1. Map of Chuanfang River and the sampling sites.
Figure 2. (a) Water quality parameters of Chuanfang River during the monitoring period, September 2013 to August 2014. March is marked with a circle because in this month, the STP effluent was pumped to the S0 to clean the river channel, making the data at S0 very different from the other months. Water temperature (WT), dissolved oxygen (DO), suspension solid (SS), five-day biological oxygen demand (BOD5) and chemical oxygen demand (COD). (b) Water quality parameters of Chuanfang River during the monitoring period, September 2013 to August 2014. March is marked with a circle because in this month, the STP effluent was pumped to the S0 to clean the river channel, making the data at S0 very different from the other months. Ammonia nitrogen (NH3-N), nitrite nitrogen (NO2-N), nitrate nitrogen (NO3-N), total nitrogen (TN) and total phosphorus (TP).
Table 1. The paired-samples t-test and correlation coefficients of water quality indicators.
Figure 3. Abundance of phytoplankton and zooplankton in Chuanfang River.
Figure 4. Factor analysis of water quality and the dominant plankton species. (a) Plot of factor loadings after rotation. (b) Standard scores of the extracted factors by regression method. The extraction method is principal component analysis. The rotation method is Varimax with Kaiser normalization.
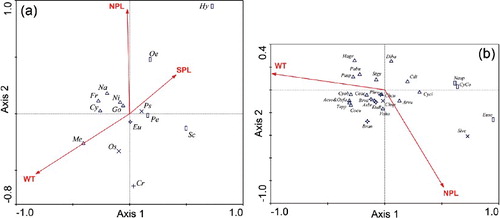
Table 2. Explanatory power of different environmental variables in canonical correspondence analysis.
Figure 5. Ordination biplots by canonical correspondence analysis. (a) Biplot of dominant phytoplankton genera and environmental variables. (b) Biplot of dominant zooplankton taxa and environmental variables.