Figures & data
Figure 1. The South Saskatchewan River Basin and the locations of hydrometric/water quality stations. The South Saskatchewan River stations are at Medicine Hat and the Red Deer River stations are at Bindloss.
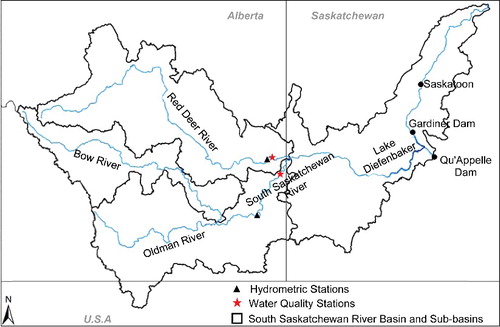
Table 1. Available data-set used for long-term nutrient transport study to Lake Diefenbaker, SK, Canada.
Table 2. Identified trends in South Saskatchewan River and Red Deer River. WRT model only works with flow-normalized series; therefore, BFAST was used for examination of none flow-normalized series and flow series. A greater detail of the descriptive statements of trend likelihood are described in Hirsch et al. (Citation2015).
Figure 2. The long-term hydrograph of SSR (left) and RDR (right). For both tributaries, the data were divided into two separate series of ‘before and after’ the identified regime shift, which was at around 1975 and 1983 for SSR and RDR, respectively.
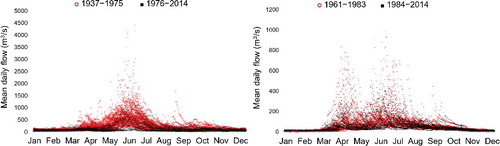
Figure 3. Monthly streamflow decomposition of the SSR at Medicine Hat station. Log-transformed flow data were used to stabilize the variances.
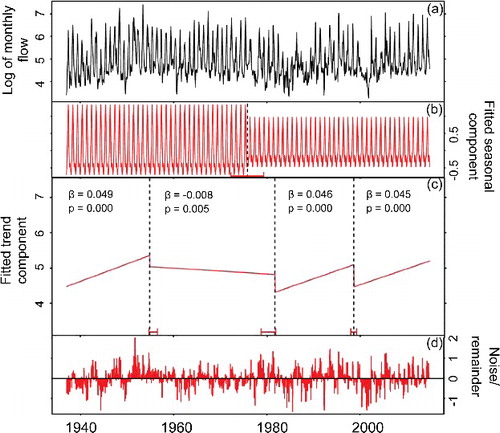
Figure 4. Histograms of SSR daily flows for the earlier and most recent periods after the identified regime shift at around 1975.
Figure 5. Plots of the standard deviation of log-transformed flow over time, SSR at Medicine Hat. (a) High flow-season, (b) low-flow season, and (c) the entire year. The vertical axis represents the standard deviation of the logged flow which is dimensionless and a measure of relative variability.
Figure 6. Long-term monthly flux and concentration estimated using WRTDS for SSR at Medicine Hat and RDR at Bindloss.
Figure 7. Trend decomposition of monthly TP flux for SSR at Medicine Hat station. Log-transformed flux data were used to stabilize the variances.
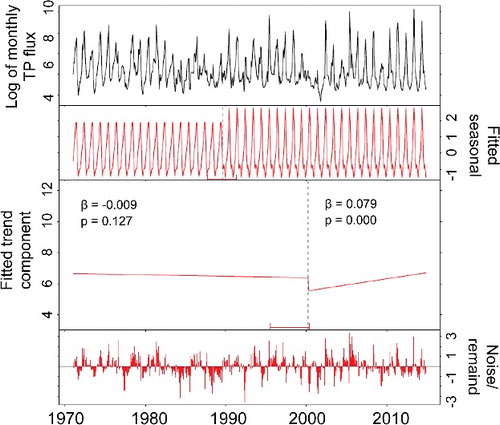
Figure 8. Annual flow, flux, and concentration series for the South Saskatchewan River at Medicine Hat.
Figure 9. A heat map created from daily concentration, flux, and flow of the South Saskatchewan River for the period of study. Both concentration and flux series are non-normalized values. Black bordered cells are values which are eight times higher than long-term mean for each variable as representation of extreme high flows, concentrations, and fluxes.
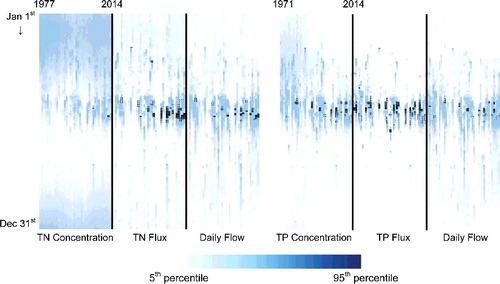
Figure 10. The relative contribution of both high-flow and low-flow season to the annual mean for each variable in the South Saskatchewan River, Medicine Hat. The solid lines are linear-trend lines for each series. High-flow season series are shown in black; low-flow season series in red.
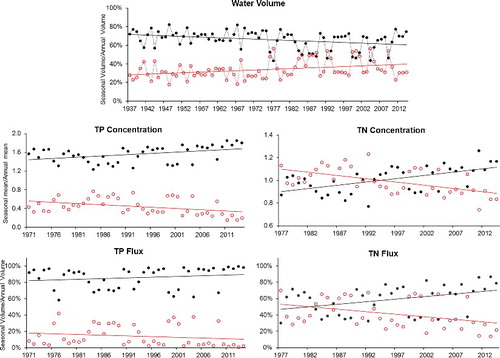
Figure 11. (a) Mean precipitation during the high-flow season period, (b) number of rainy days for the season. Dashed lines are the four-year period moving average. Data were obtained from the Interpolated Weather Data Since 1961 for Alberta Townships by the Alberta Climate Information Service for the Calgary area.
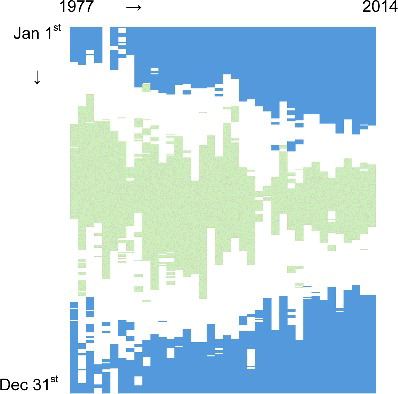
Figure 12. Daily TN:TP molar ratio during 1977–2014 for the South Saskatchewan River at Medicine Hat. Blue indicates days with TN:TP ≥ 50 as strict P-deficiency, while green represents days with TN:TP ≤ 20 as strict N-deficiency (from Guildford and Hecky Citation2000). The white area represents any value >20 and <50.