
Figures & data
Figure 1. The east branch of the Black River within the Black River Ranch, showing the location and images of our six study sites. River flow is westerly. Landscape photo from Google Earth, taken in May 2011. Site photos by the authors.
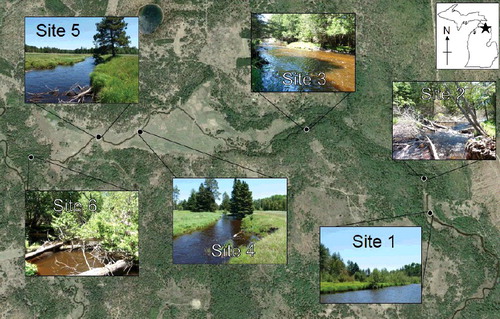
Figure 2. Opaque and transparent benthic chambers. The bottom metal strip was added in 2017.
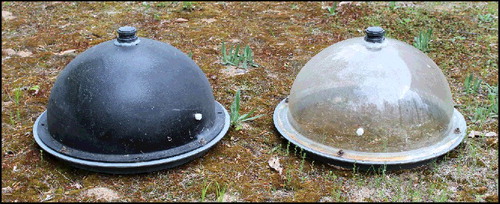
Figure 3. The percentage of light intensity from a standard incandescent bulb attenuated by our benthic chambers at wavelengths 350–1000 nm. Wavelengths outside of this range were not tested. Each marker represents the mean of ten 3-ms optical spectrometric readings at each wavelength (Ocean Optics, USB-650 Red Tide. www.oceanoptics.com). Error bars omitted for clarity.
Figure 4. Mean (+SE) amount of (A) canopy cover (B) sunlight intensity, and (C) woody debris for the six sampling sites. Superscript letters denote statistically distinct groups of means based on a Kruskal–Wallis with post-hoc Nemenyi test for each assemblage. n = 6 for canopy and woody debris data, and 12 for sunlight data.
Table 1. Summary of mean (±SE) physicochemical data, organized by forest and floodplain sites. n = 6 for all metrics.
Figure 5. Mean (+SE) number of (A) benthic genera and (B) adult caddisfly species for the six sampling sites. Superscript letters denote statistically distinct groups of means based on a one-way analysis of variance with post-hoc Tukey test for each assemblage. n = 7 for benthic genera and n = 5 for adult caddisflies.
Figure 6. Mean (+SE) percentage of the total assemblages for adult caddisfly (A) filtering collectors, (B) scrapers, and (C) shredders, and benthic invertebrate (D) filtering collectors, (E) scrapers, and (F) shredders from the six sampling sites. Superscript letters denote statistically distinct groups of means based on a one-way analysis of variance with post-hoc Tukey test for each functional group for each assemblage. n.s. = not significant. n = 7 for benthic genera and n = 5 for adult caddisflies.
Figure 7. Mean (+SE) values of three different fish metrics calculated by (A) study site and by (B) month from the same data set of combined minnow trapping and electrofishing sample pairs. Superscript letters denote statistically distinct groups of means based on a one-way analysis of variance with post-hoc Tukey test for each metric. n.s. = not significant. n = 12 sample pairs for each study site. n = 12 sample pairs for May, 36 for June, and 24 for July.
Figure 8. Mean (±SE) dissolved oxygen in (A, D) transparent chambers, (B, E) opaque chambers, and (C, F) stream column during our experiments in 2015 and 2017. n = 3 for each value.
Table 2. Mean (±SE) values for benthic metabolism metrics found during trials using transparent and opaque chambers.