Figures & data
Figure 1. Conceptual model for White Suckers. Stock-recruitment relations were simulated using either Ricker or Beverton-Holt recruitment processes. Each box represents an age-class, YOY is young of the year, S is survival, I represents non-reproductive individuals, P represents probability of maturing at a given age, X represents mature individuals, Eggs is the total number of eggs produced in a season from each mature age-class, and END limits White Sucker life expectancy to 21.
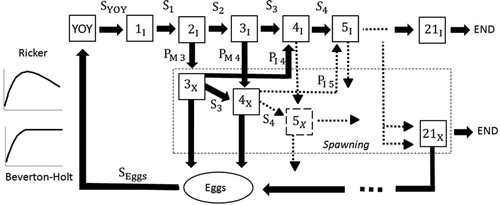
Table 1. Parameters used in the population model for White Suckers in Maine. Equations are provided and explained in the Methods section.
Figure 2. Comparison of actual and model data age structures of White Sucker populations (a) closed to harvest and (b) open to harvest. The field data in panel A consist of three unfished lakes combined, and the field data in panel B consist of three fished lakes combined (F = 0.466; see Begley et al. Citation2017). Gray bars represent actual data, black bars represent model data.
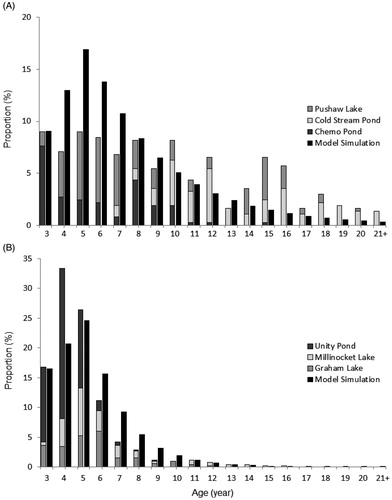
Table 2. Sensitivity (Se) analysis of White Sucker population density after a 1% increase in the α-parameter, β-parameter, natural mortality (M), fecundity function constants (a and b), and probability of recruitment to spawning for young spawners (PAges4-6). Sensitivities were run for both the Ricker and Beverton-Holt recruitment curves. ET represents the total number of eggs produced in a spawning season, YOY is recruitment to six months, and Spawner is total number of predicted spawning adults.
Figure 3. The age structure of a White Sucker population post harvesting (F) using the Ricker (a) and Beverton-Holt recruitment models (b).
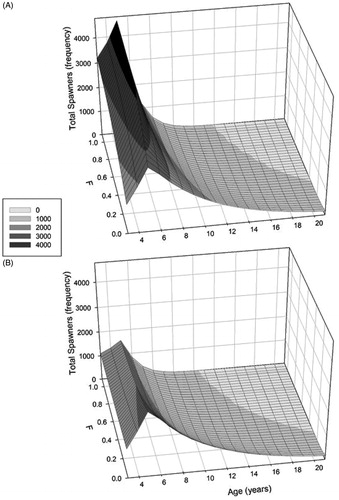
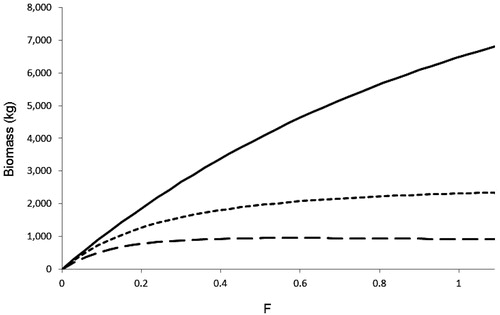
Figure 4. Modeled change in the biomass (kg) of White Suckers harvested under varying levels of additive mortality (F = 0.00 to 1.11). Solid line represents the biomass of fish harvested at the first year of harvest for both the Beverton-Holt and Ricker models. The long dashed line represents the amount harvested after values stabilized in the Beverton-Holt model, and the small dashed line represents the amount harvested after values stabilized in the Ricker model.