
Figures & data
Figure 1. Annual dynamics of two fractions of Chl-a (Chl-a and Chl-a < 25 μm) in Lake Tingtang (Wen et al.,Citation2017). The dotted and solid arrows indicate the variation trends of two fractions of Chl-a in March and April 2009, respectively.
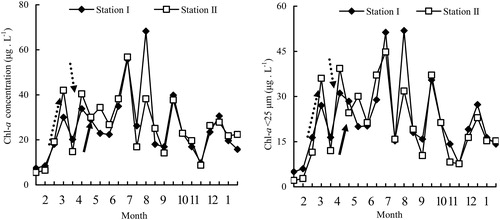
Figure 2. Principal component analyses of the environmental factors measured in this study. a: winter and spring; b: summer and autumn.
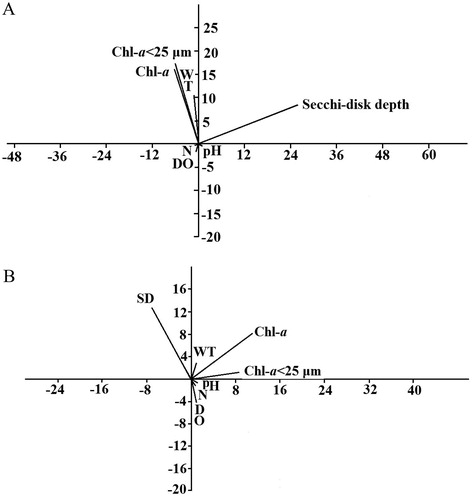
Figure 3. Annual dynamics of potential competitors and predators of B. angularis in Lake Tingtang. The dotted and arrows indicate the density dynamics of zooplankton in March and April 2009, respectively.
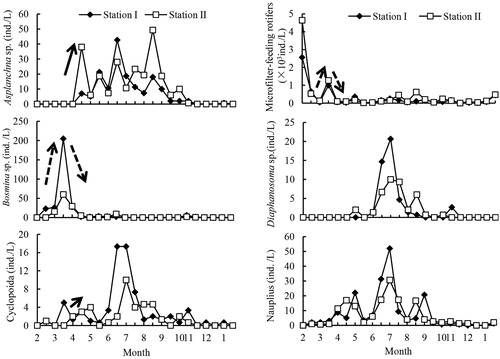
Figure 4. Dynamics of population density, egg ratio, and mixis rate of the B. angularis population in Lake Tingtang. The dotted and solid arrows indicate the density dynamics of the B. angularis population in March and April 2009, respectively.
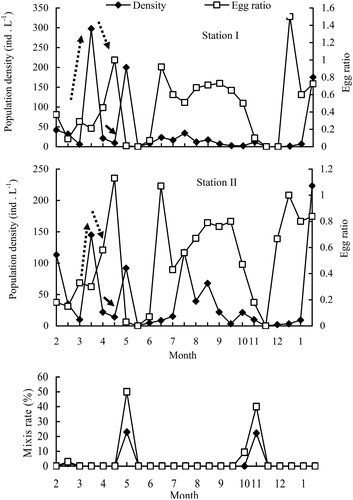
Figure 5. Regression relationships between density and egg ratio of the B. angularis population and water temperature during summer and autumn. The population density was ln (X + 1) transformed.
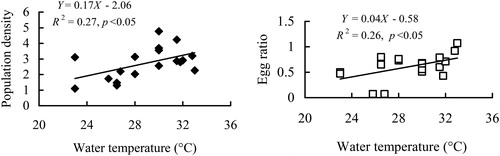
Table 1. The Pearson correlation coefficients between population density and egg ratio of B. angularis and environmental factors in Lake Tingtang. (The densities of the zooplankton listed in the table were ln (X + 1) transformed; *p < 0.05; **p < 0.01).
Figure 6. Regression relationships between egg ratio of the B. angularis population and Secchi-disk depth (a), Chl-a < 25 μm (b) and population density of B. angularis (c and d) during winter and spring. The population density in C and D was ln (X + 1) transformed and the values obtained in January 2010 when a density peak occurred were ignored in D.
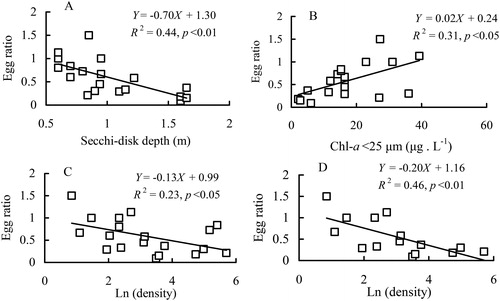
Table 2. Forward stepwise regression analyses between dependent variables of egg ratio (Y1: year-round data; Y2: winter and spring population), body size (Y3), and egg volume (Y4) and independent variables of environmental factors.
Figure 7. Regression relationships between body size and egg volume of B. angularis and water temperature in Lake Tingtang.
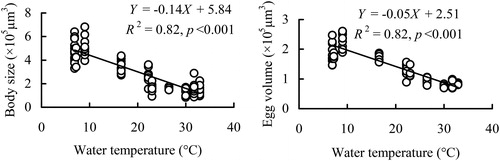
Table 3. The Pearson correlation coefficients between body size and egg volume of B. angularis and environmental factors in Lake Tingtang. (The densities of the zooplankton listed in the table were ln (X + 1) transformed; *p < 0.05; **p < 0.01).