
Figures & data
Figure 1. Map of the Leland Harris Spring Complex showing bathymetry isolines, locations of UGS shallow groundwater monitoring well SG25D, surface water and fish visual monitoring sites, and additional monitoring sites where visual surveys of fish were conducted from April through October 2013.
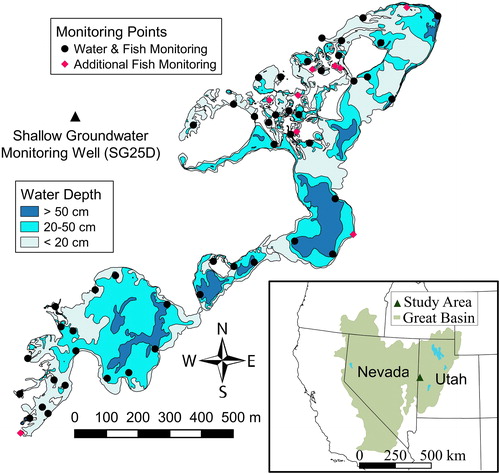
Figure 2. Groundwater levels, in terms of monthly averages of water depths with respect to ground level, at shallow groundwater monitoring well SG25D at the Leland Harris Spring Complex from 2009 through 2017.
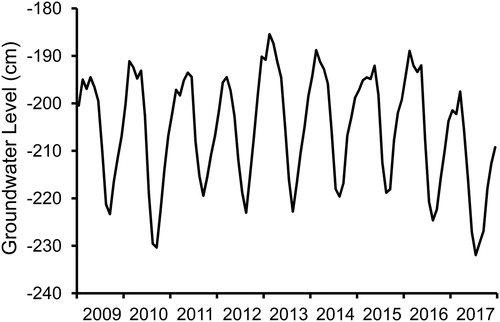
Figure 3. Mean surface water levels measured at monitoring points in springs (n = 23) and ponds (n = 24) compared to shallow groundwater levels recorded on the same dates during 15 monitoring periods from October 2012 to August 2014.
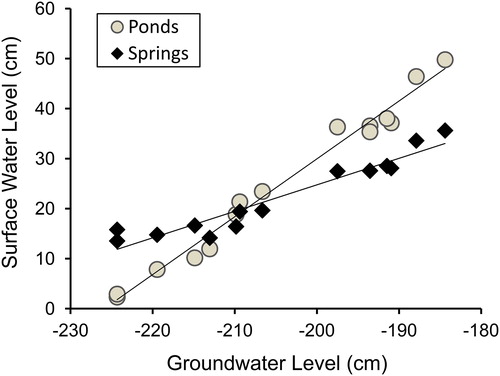
Table 1. Groundwater level (GWL), mean surface water depth at inundated bathymetry points (SWD), estimated total inundated surface area, and estimated combined volume of all bodies of water in the Leland Harris Spring Complex during each period of surface water monitoring. The total number of bathymetry points was 3852, but only those inundated at the time of the survey were used in calculating surface water depths, area, and volume.
Figure 4. Mean water depths (± 2 SE) at visual monitoring sites occupied by juvenile Least Chub, juvenile Utah Chub, adult Least Chub, and adult Utah Chub during surveys conducted from April to October of 2013. In all cases with non-overlapping error bars, Mann-Whitney U-tests indicated that there was a significant tendency for occupied sites to be deeper than unoccupied sites (P < 0.05).
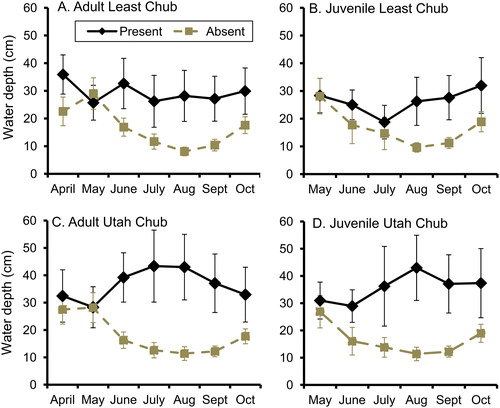
Table 2. Numbers of visual monitoring sites at springs and ponds in which juvenile Least Chub, adult Least Chub, juvenile Utah Chub, and adult Utah Chub were detected during visual surveys from April through October of 2013. There were 50 monitoring sites in all, 23 in springs and 27 in ponds or lentic marsh habitat, of which 40 (19 in springs and 21 in ponds) were used by fish at least once during the visual monitoring surveys.
Figure 5. Isoline map of the Leland Harris Spring Complex based on water level measurements at surface water monitoring points and corresponding estimates of surface water depths at 3852 bathymetry points during 21 August 2013. Regions of the spring complex that became isolated, or in which movement of fish to and from other regions was greatly restricted, are labelled. Dashed lines indicate boundaries between adjacent regions.
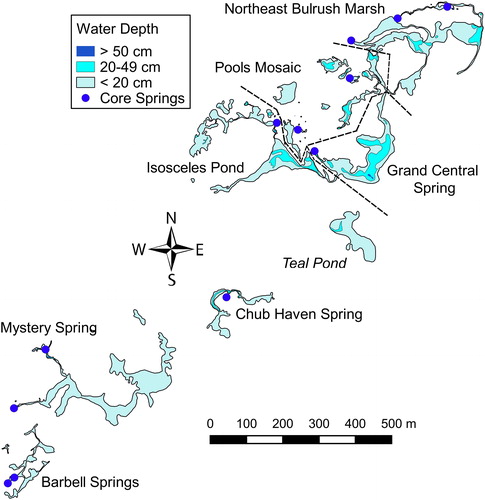
Table 3. The number of isolated bodies of water (patches) occupied by Least Chub and by Utah Chub, the estimated combined surface area of the bodies of water inhabited by each species, and the percentage of the inundated area of the spring complex represented by these bodies of water (%) during visual monitoring surveys from April through October of 2013.
Table 4. Comparison of water depths (mean, median, and 25–75% quartile range) at locations of traps in which individuals were present compared to traps in which they were absent for juvenile Least Chub, adult Least Chub, juvenile Utah Chub, and adult Utah Chub during 2013 and 2014 monitoring surveys. The Mann-Whitney U-test statistic and P-values are also shown for each comparison.
Table 5. The mean and range of total length (TL) measurements of juvenile and adult Least Chub captured and measured in each region of the Leland Harris Spring Complex during August and September of 2012–2014.
Table 6. Total number and number per trap of Least Chub and Utah Chub captured in each region of the Leland Harris Spring complex during population monitoring surveys conducted in August-September of 2012–2014. The mean and range of total length (TL) measurements obtained from Utah Chub that were captured and measured in each region is also given.
Data availability
The data collected and analyzed in this study is accessible to the public under the DOI: 10.6084/mp.figshare.7121699.