Figures & data
Figure 1. Location of study lakes (black circles) in the Old Crow Flats (Yukon, Canada). Numbers indicate lake name for consistency with prior work in the study region (Turner et al. Citation2010).
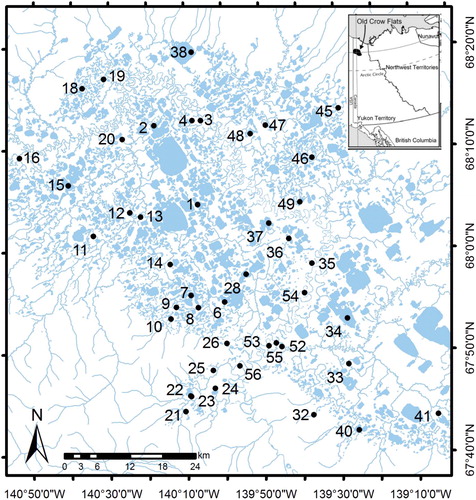
Figure 2. Scatterplots showing the relationships among the 44 lakes of the Old Crow Flats between periphytic diatom community alpha diversity and environmental variables represented by the eigenvalue-weighted sum of PCA axis 1 and 2 scores, summarized by the sum of eigenvalue weighted site scores of the first and second axis of a Principal Component Analysis (PCA), on water isotopes and water chemistry (top panel). Relationship of residual alpha diversity and lake surface area (bottom panel).
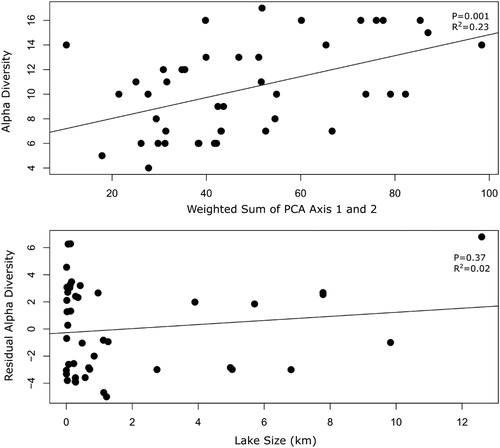
Figure 3. Alpha diversity of diatoms, after statistically controlling for environmental heterogeneity, in small (n = 15), medium (n = 14) and large (n = 15) lake-size categories in the Old Crow Flats (Yukon, Canada). Periphyton samples accrued during the ice-free season in 2009. Error bars represent standard error.
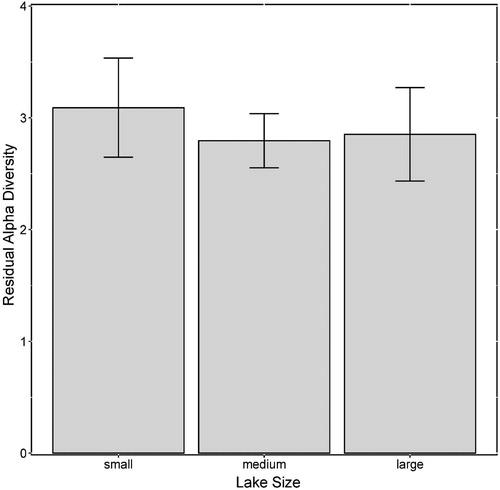
Table 1. ANOVA and Mantel test results comparing alpha diversity, beta diversity and community composition-environment congruence in differently sized lake categories in the Old Crow Flats.
Figure 4. Pairwise relationships between beta diversity of diatoms and environmental dissimilarity in small, medium and large lake-categories in the Old Crow Flats (Yukon, Canada). Periphyton samples accrued during the ice-free season in 2009. Beta diversity here is partitioned into its turnover and nested components.
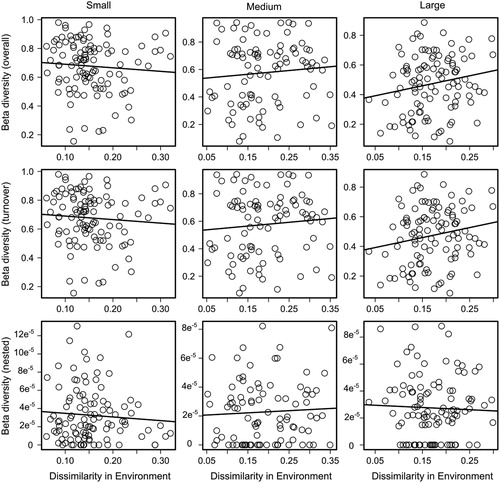
Figure 5. Mean and standard error of total and residual beta diversity of diatoms in small (n = 15), medium (n = 14) and large (n = 15) lake size-categories in the Old Crow Flats (Yukon, Canada). Beta diversity is partitioned into total (dark grey), turnover (light grey) and nestedness (white) components. Error bars represent standard error.
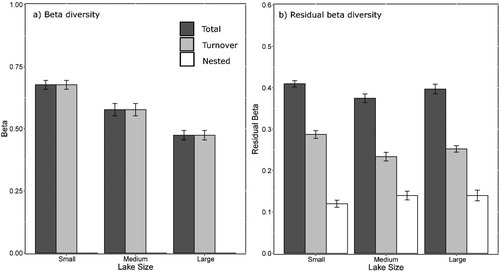
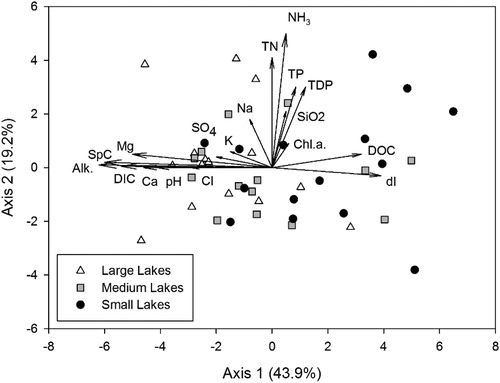
Figure A1. Principal Components Ordination diagram from analysis of water chemistry variables obtained from 44 lake sites in the Old Crow Flats (Yukon, Canada) in 2009. The sites (sample scores) are coded according to size as small (black circles), medium (grey squares) or large (white triangles).