Figures & data
Figure 1. Pacific Lamprey NatureServe Climate Change Vulnerability Index results for mid and end-century time periods using the CMIP3 downscaled moisture and air temperature from ensemble model under the A1b and A2 carbon emission scenarios (Schaller and Wang Citation2011).
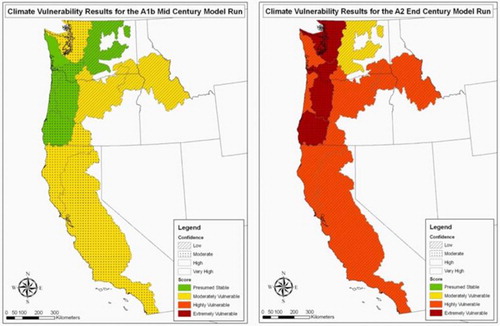
Figure 2. The 15 river basins and larger geographic groupings used for the Pacific Lamprey vulnerability assessment.
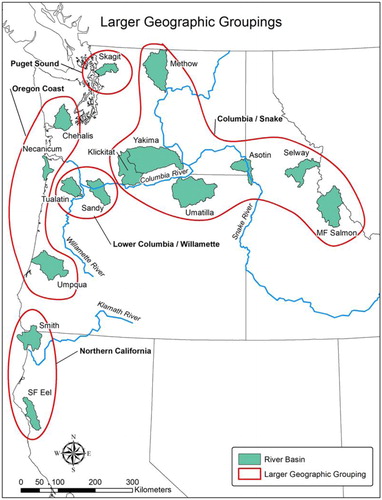
Figure 3. Relation between exposure to local climate change and sensitivity factors (modified from Young et al. Citation2011, ).
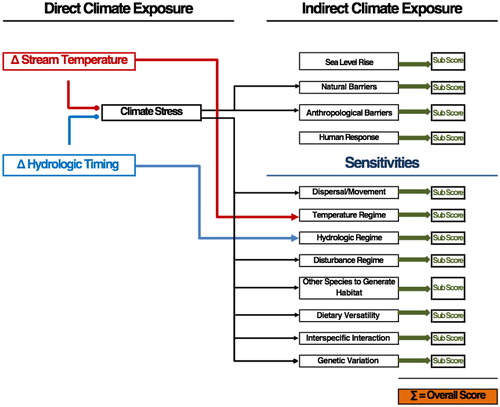
Table 1. Summary of CCVI risk scores by GCM in both RCP 4.5 and 8.5 greenhouse gas emission scenarios for mid and end-century time periods.
Figure 4. The air/stream temperature relations to convert CMIP5 air temperature to stream temperature for Climate Change Vulnerability Index estimates (D. Isaak NorWeST 2015).
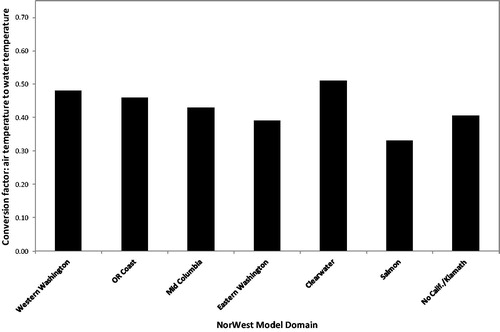
Table 2. Summary of CCVI risk categories by GCM in both RCP 4.5 and 8.5 greenhouse gas emission scenarios for mid and end-century time periods.
Figure 5. Pacific Lamprey Climate Change Vulnerability Index simulations using downscaled CSIRO-Mk3-6-0 model exposure.
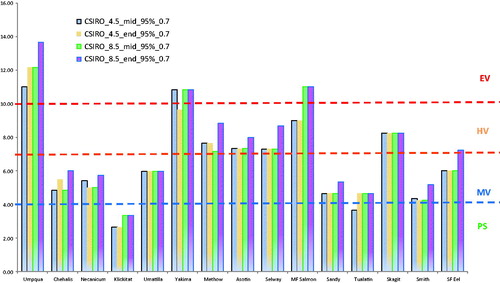
Figure 6. Pacific Lamprey Climate Change Vulnerability Index simulations using downscaled bcc-csm1-1-m model exposure.
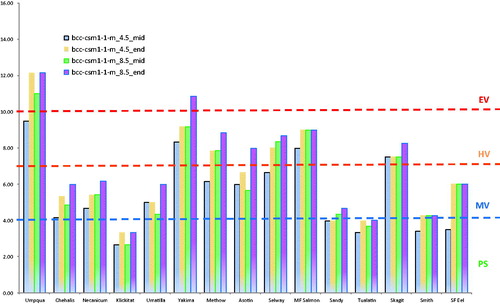
Figure 7. Pacific Lamprey Climate Change Vulnerability Index simulations using downscaled NORESM1-M model exposure.
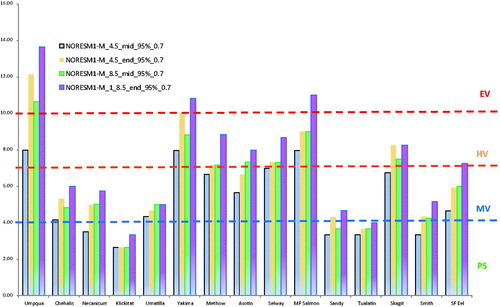
Figure 8. Pacific Lamprey Climate Change Vulnerability Index simulations. Comparison for three Global Climate Models for mid-century and Representative Concentration Pathway 4.5.
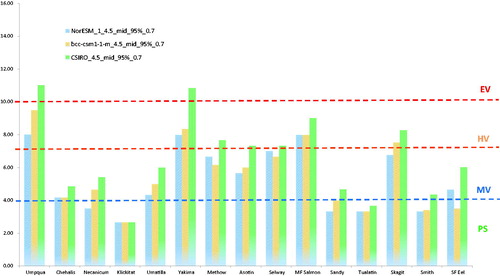
Figure 9. Pacific Lamprey Climate Change Vulnerability Index simulations. Comparison for three Global Climate Models for end-century and Representative Concentration Pathway 4.5.
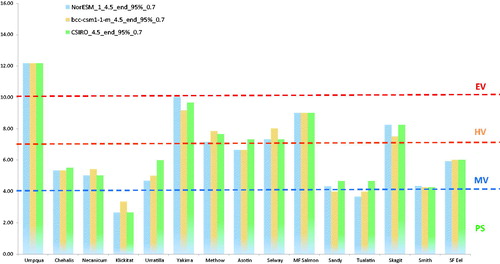
Figure 10. Pacific Lamprey Climate Change Vulnerability Index simulations. Comparison for three Global Climate Models for mid-century and Representative Concentration Pathway 8.5.
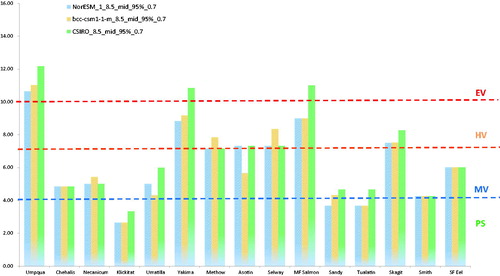
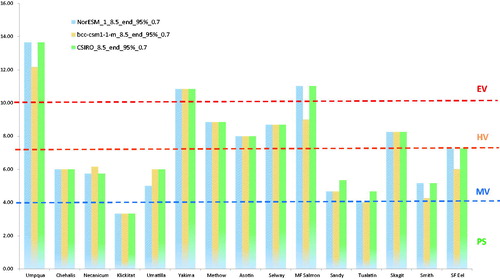
Figure 11. Pacific Lamprey Climate Change Vulnerability Index simulations. Comparison for three Global Climate Models for end-century and Representative Concentration Pathway 8.5.