
Figures & data
Figure 1. The Pearl River, including its three main tributaries (West, North and East River) and the Pearl River Delta system. Sampling sites are represented by black dots: FK-Fengkai, DQ-Deqing, ZQ-Zhaoqing, QQ-Qingqi, ZT-Zuotan, WH-Waihai, XW-Xinwei, XL-Xiaolan, XT-Xiaotang, BJ-Beijiao, LH-Lanhe, HL-Hengli, CC-Chencun, SQ-Shiqiao, LHS-Lianhuashan and ZJQ-Zhujiangqiao.
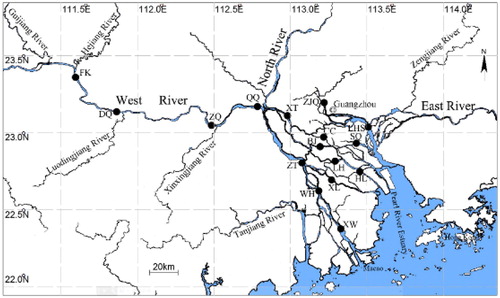
Table 1. Sampling site coordinates.
Figure 2. Non-metric multidimensional scaling (NMDS) model based on size-fractionated chlorophyll a. Group 1 (G1), West River; Group 2 (G2), central Pearl River Delta; Group 3 (G3), Guangzhou city center; PRD, Pearl River Delta.
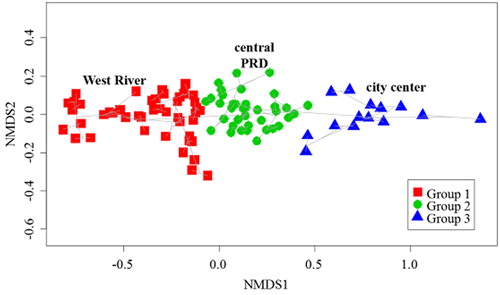
Figure 3. (a) Chlorophyll a concentration and (b) the percentage of each size fraction of phytoplankton in G1 (West River), G2 (central Pearl River Delta) and G3 (Guangzhou city center).
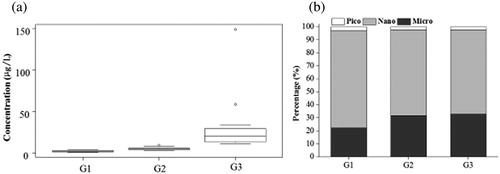
Figure 4. Results from the LDA analysis on correlations between clusters (Groups 1, 2 and 3) and environmental variables showing: (a) the distribution and overlap of clusters in F1 and F2 dimensions, and (b) the distribution of water quality parameters corresponding to F1 and F2.
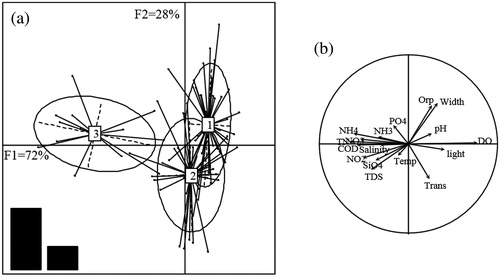
Table 2. Species with greater than 5% occurrence in the three groups: G1 (West River), G2 (central Pearl River Delta) and G3 (Guangzhou city center) waters.
Table 3. Environmental factors measured at G1 (West River), G2 (central Pearl River Delta) and G3 (Guangzhou city center) (mean values across sampling sites for each group).
Table 4. Temporal variation in physico-chemical factors and Chl-a related to the spatial pattern (mean values across all sampling sites) G1 (West River), G2 (central Pearl River Delta) and G3 (Guangzhou city center).