Figures & data
Figure 1. Map showing the headwaters of the Current River and the Cedar Grove study area (37°25′19″ N, 91°36′30″ W). Northern Hog Sucker release sites (diamonds), low-water crossings (dark and light rectangles), and commonly used access points (triangles) are represented. Main tracking efforts were conducted between Baptist and Akers Ferry access points with periodic extended surveys to Two Rivers.
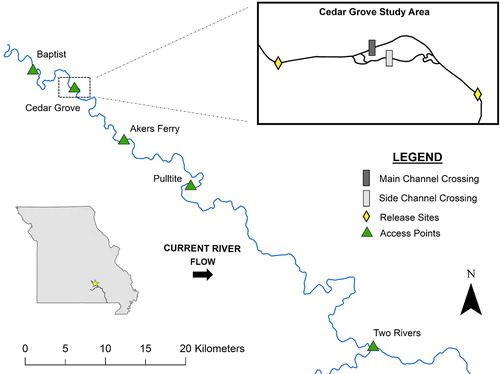
Figure 2. (A) Downstream view of the main channel crossing at Cedar Grove. (B) Upstream view of the main channel crossing showing heavy amounts of sediment deposition. (C) Downstream view of the side channel crossing at Cedar Grove. (D) Upstream view of the side channel crossing showing lighter sediment deposition. Pictures were taken February 9, 2018. Discharge at the Cedar Grove low-water crossing is 2.33 m3/s (Akers Ferry = 5.10 m3/s).
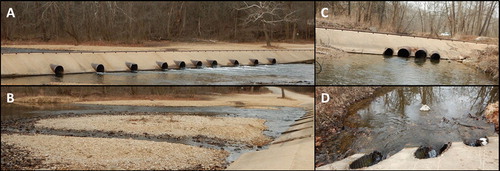
Table 1. Physical characteristics of the main and side channel crossing and associated culverts.
Table 2. Physical characteristics of the upstream impoundment pool and downstream plunge pool associated with the main and side channel crossing at Cedar Grove.
Figure 3. Stream discharge at USGS gauge station 07064533 during the study period. The gauge is approximately 13 Km downstream of the crossing near Akers, MO. Sampling events are represented on the x-axis with the two tagging events indicated by circles. Arrows indicate when a fish passage was detected and the direction of that passage (upstream/downstream). Numbers above each arrow represent the ID of each fish which passed (Appendix). The 17 year annual mean discharge (12 m3/s) and point in which the water level at the crossing reached the top of the culverts (70 m3/s), and inundated the crossing (300 m3/s) are plotted on the hydrograph. Flow classifications used in the study are represented on the right side of the y-axis.
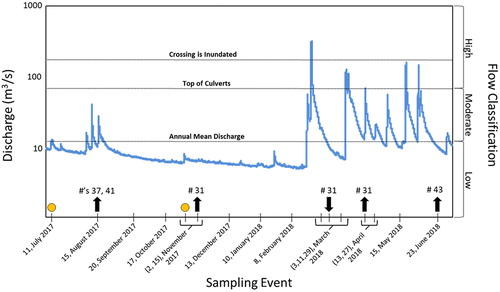
Figure 4. Image of the pseudo-fish ladder formed along the edge of the main channel crossing following heavy rainfall. The discharge at Akers Ferry is approximately 28 m3/s during this photo. Picture taken August 17, 2017.
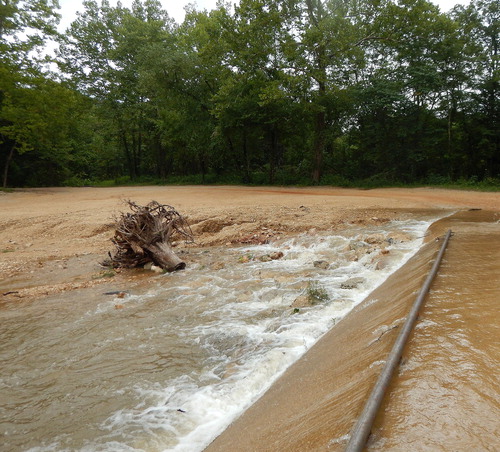
Figure 5. Frequency distribution representing the direction of maximum displacement of Northern Hog Suckers around the Cedar Grove low-water crossing. Mobile fish above and below the crossing are represented on the two left panels while stationary fish above and below the crossing are represented on the right panels. Release sites (0, bold) and the position of the crossing relative to release sites (dashed verticle line) are represented on the x-axis. Positive displacement reflects upstream movement and negative displacement reflects downstream movement.
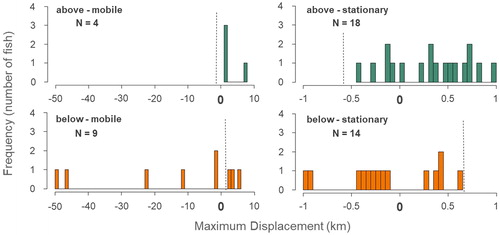
Table 3. Results of two-way ANOVAs for effects of tagging location and mobility type on maximum displacement and directional maximum displacement of Northern Hog Suckers.
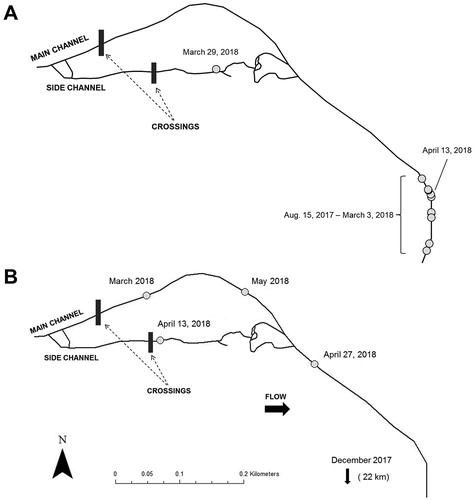
Figure 6. (A) Map showing the upstream movement of an individual (Fish # 40, Appendix) into the side channel during a period of high flow before returning downstream. (B) Map showing the movements exhibited by an individual (Fish #44, Appendix) from the main channel crossing to the side channel crossing after completing a long upstream migration.