Figures & data
Figure 1. Location of study area.
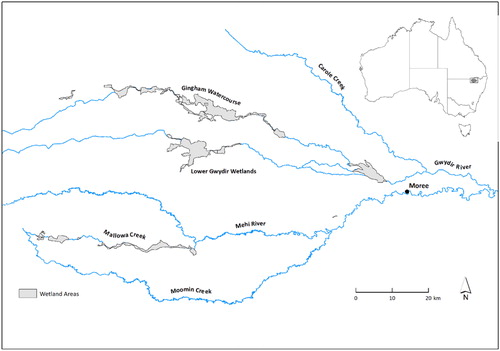
Figure 2. Mean invertebrate densities (± 1 S.E.) in (a) benthos and (b) plankton. Black columns denote Bunnor mesocosms and white Old Dromana.
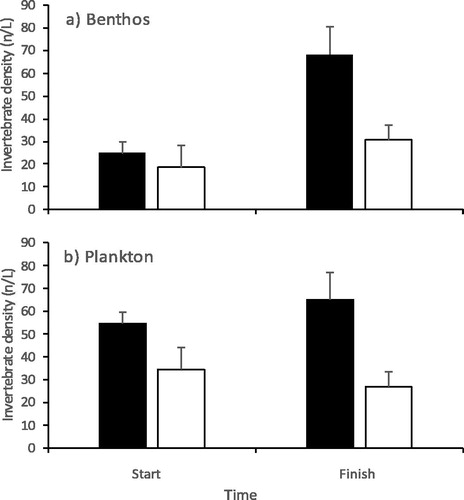
Figure 3. MDS ordination of invertebrate assemblages. (a) Coded for wetland type (black triangles = Bunnor samples; white triangles = OD samples. (b) The same ordination coded for different habitats at the start and end of the experiment (circles = benthos; squares = plankton; black shapes = start; white shapes = end).
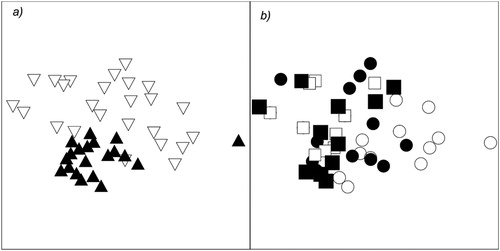
Table 1. Average ranks of taxa contributing to differences between various groups of samples SIMPER.
Figure 4. Relationship between zooplankton density and Murray cod larval survival. Black circles Bunnor wetland mesocosms and white circles Old Dromana mesocosms.
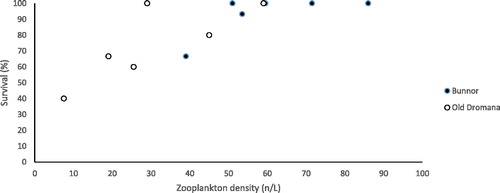
Figure 5. Manly-Chesson prey selection index α, the horizontal line is the neutral value for selectiveness.
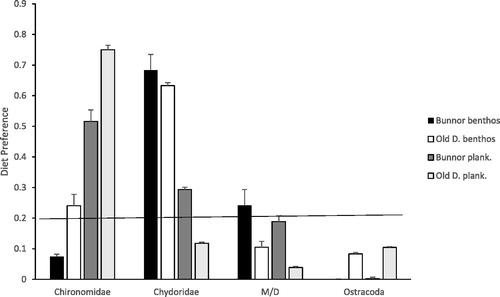
Table 2. Mean percentage (± 1 S.E.) of each fatty acid in substratum fractions and biota in each wetland.
Figure 6. Mean (± 1 S.E.) carbon to nitrogen ratios in various potential food sources. Black columns are from Bunnor mesocosms and white from Old Dromana mesocosms.
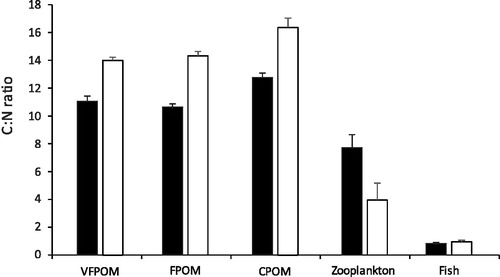
Figure 7. Mean (± 1 S.E.) sum of n-3 and n-6 polyunsaturated fatty acids (PUFA) in various potential food sources. Black columns are from Bunnor mesocosms and white from Old Dromana mesocosms.
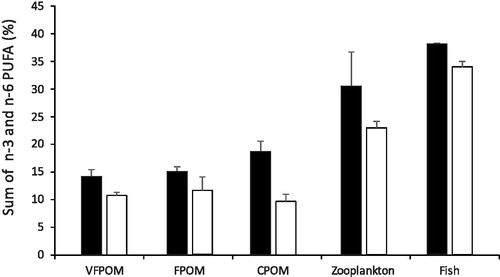
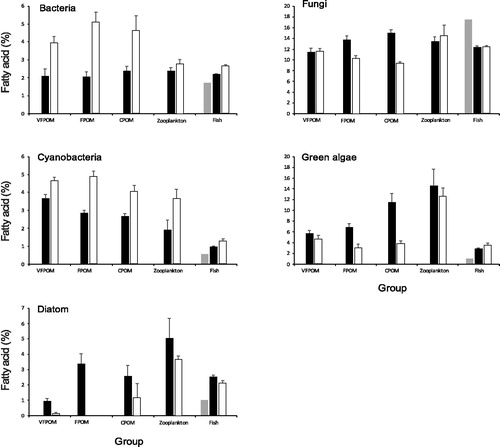
Figure 8. Mean percentage (± 1 S.E.) of fatty acid biomarkers in different substratum sizes and animal groups from Bunnor mesocosms (black columns) and Old Dromana mesocosms (white columns). Grey columns indicate the fatty acid biomarkers present in Murray cod larvae at the start of the experiment.