
Figures & data
Figure 1. Water level fluctuations and changes in exposure time and soil water content along sample transects. Soil water content in middle and upper parts of the fluctuation zone changes within a certain range with water level fluctuation, while soil water content in the lower part of the fluctuation zone decreases sharply with rapid decline of water level.
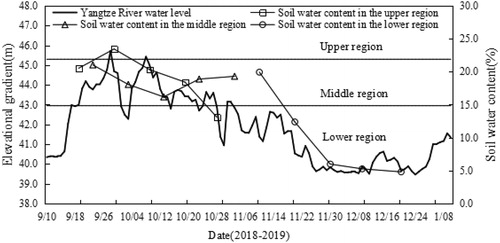
Figure 2. Allometric relationships between leaf number, leaf-and-branch volume, and leaf-and-branch water content with leaf-and-branch dry mass of M. laxiflora at different growth recovery times. Allometric relationship between leaf traits differs among different plant recovery times.
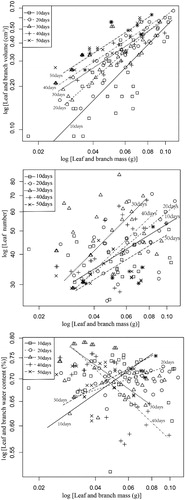
Table 1. Regression analysis of leaf trait relationships by standardized major axis estimation (SMA) at different recovery growths along elevation gradients. Relationship between leaf traits varies with recovery time and elevation gradient.
Figure 3. Allometric relationships between leaf number, leaf-and-branch volume, and leaf-and-branch water content with leaf-and-branch dry mass of M. laxiflora along different water level gradients. Allometric relationship between leaf traits differs among water level gradients.
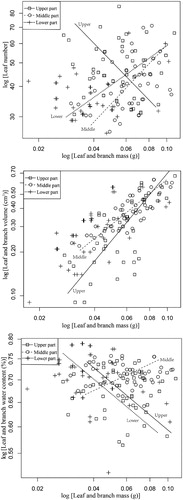
Table 2. Test for slope heterogeneity of leaf trait relationships and common slope for each water level gradient. Common slope varies among different water level gradients.