Figures & data
Figure 1. Map of the study area indicating the locations of the three sampling sites.
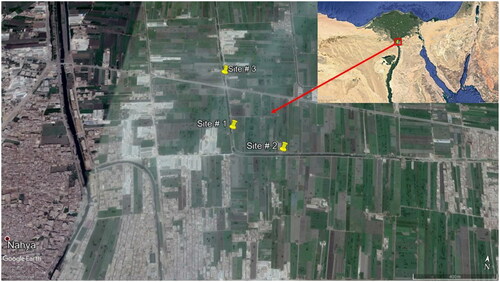
Figure 2. Monthly variation in the water nutrient concentrations (mg/l) in Al-Sero Drain (South Nile Delta, Egypt) supporting Pistia stratiotes populations. Vertical bars indicate the standard errors of the means (n = 9). F-values represent the repeated measures ANOVA. ***: p < 0.001, df: degrees of freedom.
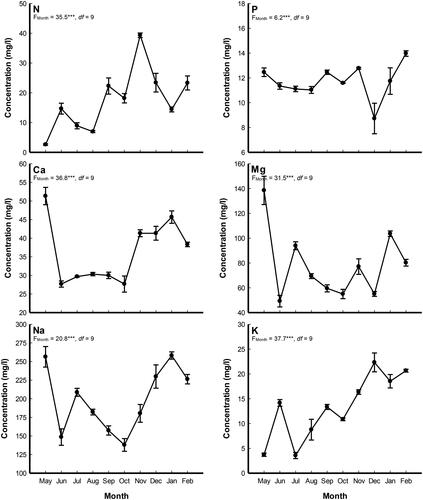
Figure 3. Monthly variation (mean ± standard error) in shoot and root systems biomass (g DM/m2) of Pistia stratiotes populations grown in Al-Sero Drain (South Nile Delta, Egypt). F-values represent the two-way analysis of variance (ANOVA-2), ***: p < 0.001.
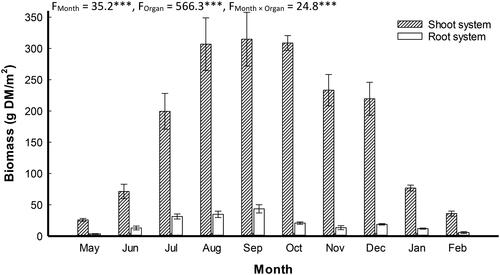
Figure 4. Monthly variation in the nutrient concentrations (%) in shoot and root systems of Pistia stratiotes populations grown in Al-Sero Drain (South Nile Delta, Egypt). Vertical bars indicate the standard errors of the means (n = 9). F-values represent the two-way analysis of variance (ANOVA-2). ***: p < 0.001.
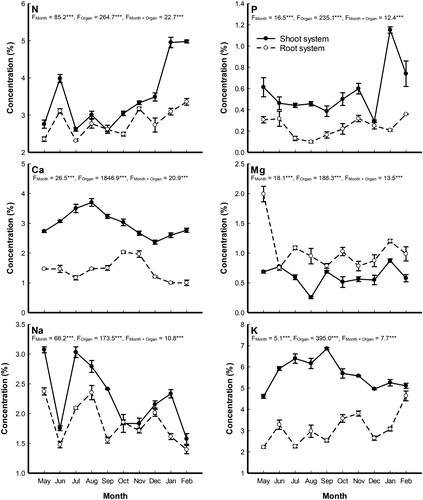
Figure 5. Monthly variation in the nutrient standing stocks (g/m2) in shoot and root systems of Pistia stratiotes populations grown in Al-Sero Drain (South Nile Delta, Egypt). Vertical bars indicate the standard errors of the means (n = 9). F-values represent the two-way analysis of variance (ANOVA-2). ***: p < 0.001.
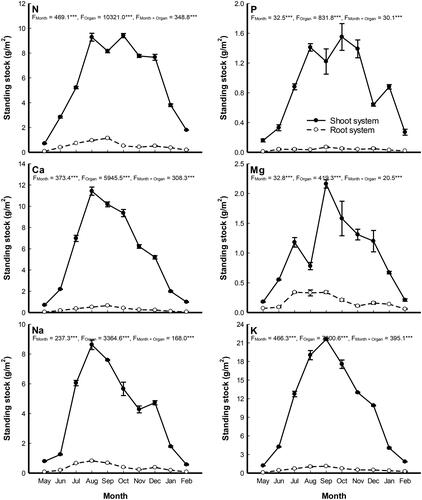
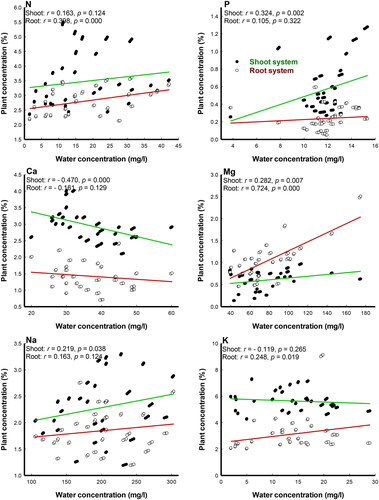
Figure 6. Pearson’s correlation coefficient (r-values, n = 90) between nutrient concentrations in the water and two Pistia stratiotes organs in Al-Sero Drain (South Nile Delta, Egypt).