
Figures & data
Figure 1. Map of Ghana, showing the three study areas (Bomfobiri Wildlife Sanctuary Source and Boufrom Forest Reserve – Protected areas and Soboyo community – unprotected area), in the Kumawu District. The four riparian zones are represented by the following colours in the legend: yellow – Onwame riprian zone (ORZ), violet – Pame riparian zone (PRZ), bright green – Ninian riparian zone (NRZ) and red – Amobia riparian zone.
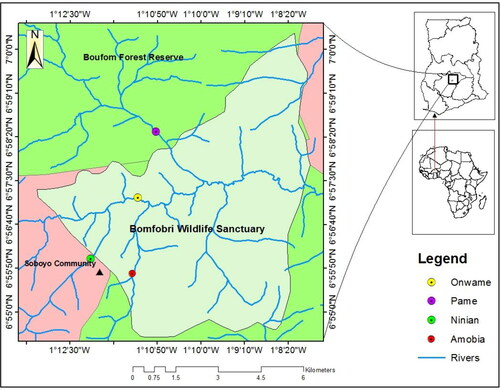
Table 1. Riparian quality index method (RQI) (Gonzalez del Tanago and Garcia de Jalon Citation2011), used to classify the four riparian zones according to their different habitat conditions, in Bomfobiri Wildlife Sanctuary and Boufum forest reserve and Soboyo community.
Figure 2. a & b: Principal component analysis (PCA) diagram, showing variability in species response to seven disturbance-related drivers in the 120 plots, across the four riparian zones. Plot codes represent the following: ARZ = Amobia riparian zones; ORZ = Onwame riparian zones; NRZ = Ninian riparian zones and PRZ = Pame riparian zone. The black dots represent plant species (e.g. Kyllinga bulbosa = Kbulb, Mariscus longibracteatus = Mlong, Setaria sphacelate = Sspha andPaspalum distichum = Pdist), while the arrows represent the disturbance-related drivers plotted pointing in the direction of maximum change of explanatory variables of the different sample plots. Axis I = 31.74% and Axes II = 21.74% jointly explained 53.48% influence of disturbance-related drivers on the habitat condition and species coexistence.
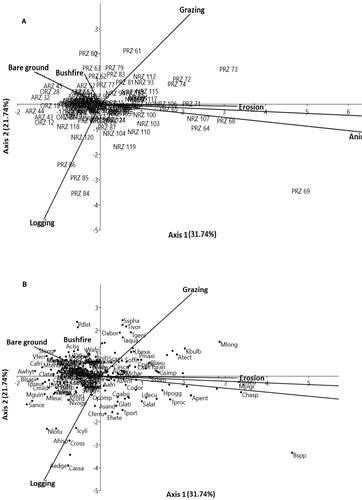
Figure 3. Gaussian curve or lognormal distribution curve showing how competing species at plot level coexist in their niche space (n-dimensional environmental space) and niche overlaps, along environmental gradient. Notice that severely disturbed Ninian and Pame riparian zones, recorded high species abundance at plot level, whereas less disturbed zone like Amobia, had less abundant species. The x-axis represents disturbance-related drivers in sample plot/riparian zone, calculated as the ‘driver magnitude’ (i.e. a sum of the value score for scope and severity assigned to a specific driver per plot and ranked from highest to lowest – Salafsky et al. Citation2003; Battisti et al. Citation2009 ).The alphabets denote the following: u = optimum, t = tolerance and m = maximum.
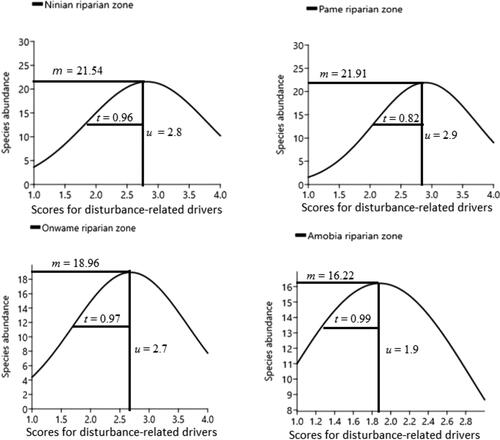
Table 2. Mean number of plants sampled in each of the 120 plots, across the four riparian zones.
Table 3 Summary of the average scores for seven disturbance-related drivers assessed in each of the 120 plots among the four riparian zones.
Table 4. Summary of CCA axis lengths, showing the levels of correlation between four riparian zonesand seven disturbance-related driver gradients and percentage variance in species assemblages in 120 plots.
Table 5. Spearman Rank Intercorrelations between the environmental variables.
Figure 4. Comparison of estimated species richness among the four riparian zones.
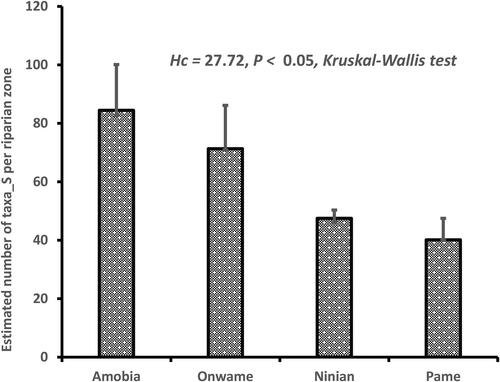
Figure 5. Hill numbers showing diversity profiles among the four riparian systems, in the protected and unprotected areas. Variability in the shape of the curves is indicative of species evenness distribution patterns in each of the four riparian systems. Thus, shallow curve reflects high diversity of a site, while steep curve indicates less diversity.
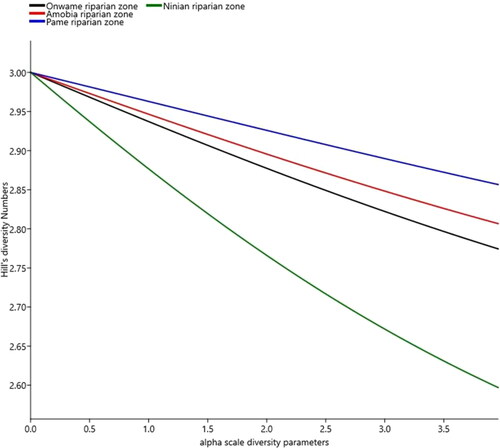
Table 6. Summary of Hill numbers (at α = 0, 1 and 2), Hill species diversity and Shannon_Evenness, across the four riparian zones in protected and unprotected areas, at Kumawu District of Ghana.
tjfe_a_1985642_sm3897.docx
Download MS Word (46.2 KB)Data availability statement
The code and data used in the analysis of this study, will be publicly accessible at Dryad Digital Repository (https://datadryad.org/).