Figures & data
Figure 1. Geographic position and sampling sites location in the Daihai Lakeshore.
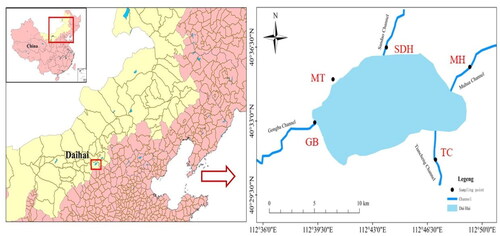
Figure 2. The abundance distribution characteristics (a), size (b), shape (c) and color (d) proportion of microplastics in the lakeshore of Daihai Basin. It depicts the variance of size, shape and color in all sampling sites.
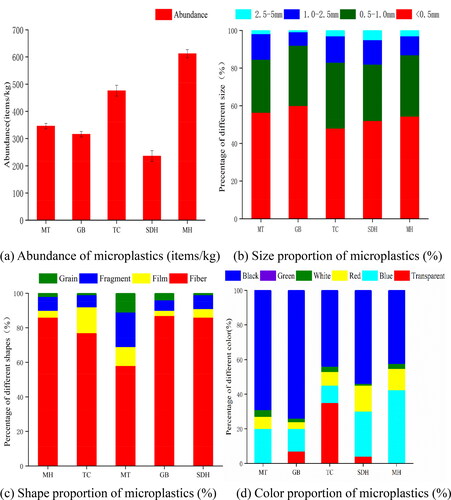
Figure 3. Abundance of microorganism of sediments in the lakeshore of Daihai Basin. Cluster with abundances >0.3% in samples are shown. (a) Phylum level and (b) Genus level.
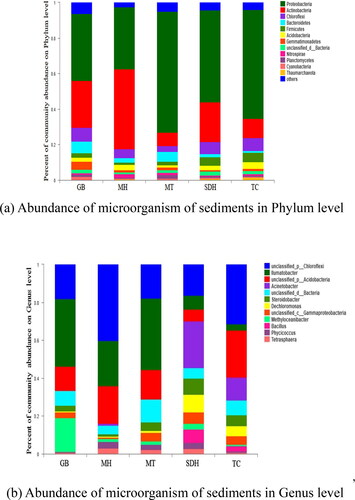
Table 1. Abundance of the top seven dominant microorganism (phylum level).
Table 2. Physicochemical profile of the sediment samples.
Table 3. Correlation between micropalstics, physicochemical properties and dominant microorganism.
Figure 4. Redundancy analysis of dominant microorganism in phylum level by microplastics and physicochemical factors.
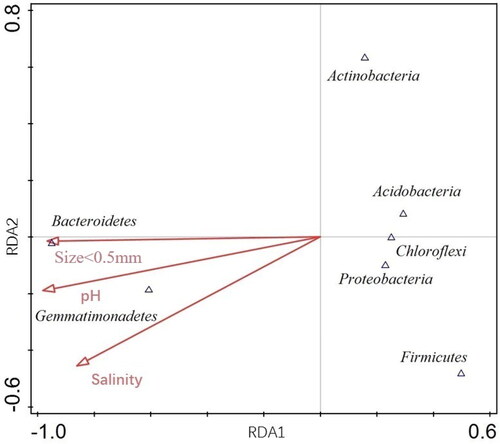
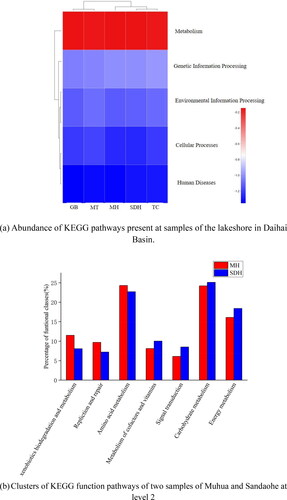
Figure 5. The abundance of KEGG pathways present at the sediments samples in level 1 (a) and level 2 (b).