Figures & data
Figure 1. Map of River Adada indicating sampling stations. Station A (upstream or S1), station B (mid-stream or S2), station C (downstream or S3).
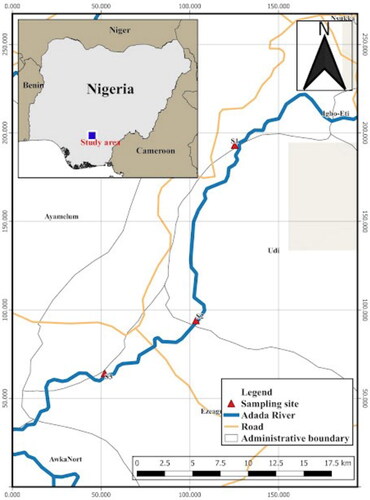
Table 1. From the total number of zooplankton, the rainy season had the highest number of encountered individuals. By stations and seasons, C had more number of individuals in the dry season, while station B in the rainy season (Table 1a). There was no significant difference in zooplankton abundance with seasons (Table 1 b). The multiple pairwise-comparison (Tukey contrasts) between different stations also found no significant difference in zooplankton abundance (table 1c). Significant term in bold.
Table 2. Indicating that copepods (n = 798) were the most encountered zooplankton, followed by the rotifers (n = 564), cladocerans (n = 476) and Ostracods (n = 381). However, the cladocerans had more number of life forms (n = 10 species), followed by copepods (n = 8), rotifers (n = 7) and ostracods (n = 2).
Table 3. Comparing values from the dry and rainy seasons, the mean water temperature in station A was high during dry season. Meanwhile, turbidity in station B, DO (station B), pH (station C), PO4³⁻ (station B) and NO3- (station A) were all high in the rainy season.
Table 4. Zooplankton abundance in station A in relation to physical and chemical indices of River Adada. Indicating that zooplankton abundance in the river was not only affected by seasons, pH, turbidity, PO4³⁻, and DO but the joint interactive effect of temperature on DO, PO4³⁻, and pH as well. Significant terms are in bold, while insignificant terms are not included in the table. Insignificant predictors may not be statistically significant, but had a joint significant effect in the presence of another predictor (temperature), thus, included in the table.
Table 5. Zooplankton abundance in station B in relation to physical and chemical indices of River Adada. Indicating that zooplankton abundance in the river is not only affected by seasons, turbidity, PO4³⁻, NO3-, and DO but the joint effect of temperature on DO, and NO3-. Significant terms are in bold, while insignificant terms are not included in the table. Insignificant predictors may not be statiscally significant, but had a joint significant effect in the presence of another predictor (temperature), thus, included in the table.
Table 6. Zooplankton abundance in station C in relation to physical and chemical indices of River Adada. Indicating that zooplankton abundance in the river is not only affected by temperature, turbidity, PO4³⁻, NO3-, and DO but the joint effect of temperature on DO, and PO4³⁻. Significant terms are in bold, while insignificant terms are not included in the table. Insignificant predictors may not be statiscally significant, but had a joint significant effect in the presence of another predictor (temperature), thus, included in the table.
Figure 2. Zooplankton in relation to temperature (°C) in station A, n = 594.
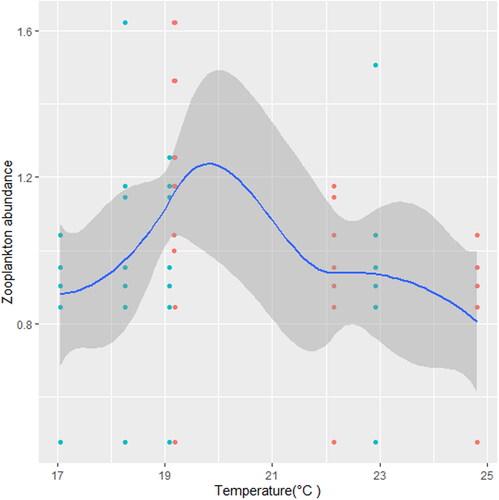
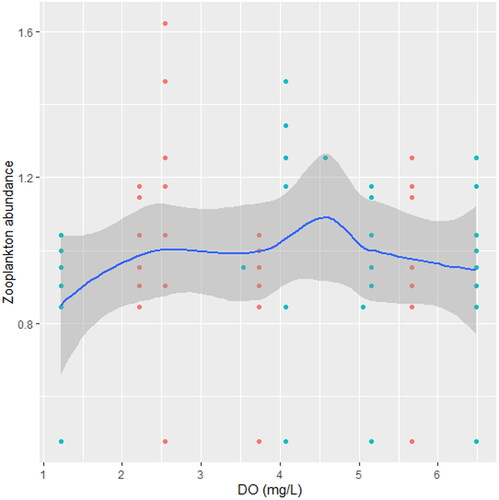
Figure 3. Zooplankton in relation to DO (mg/L) in station A, n = 594.
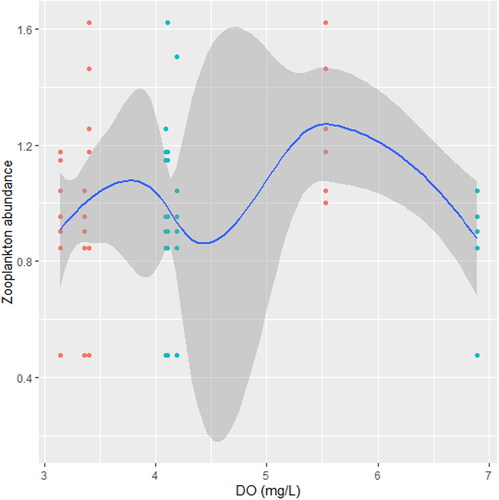
Figure 4. Zooplankton in relation to phosphate in station A, n = 594.
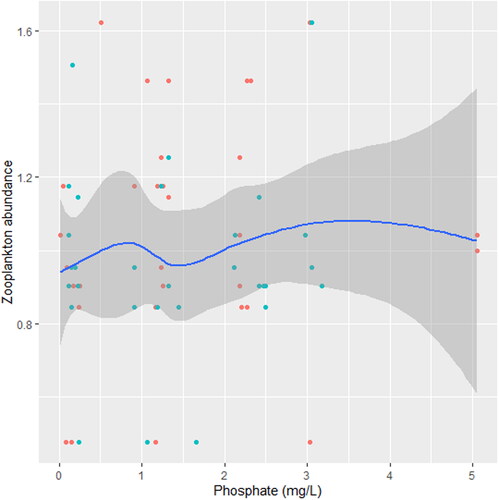
Figure 5. Zooplankton in relation to pH in station A, n = 594.
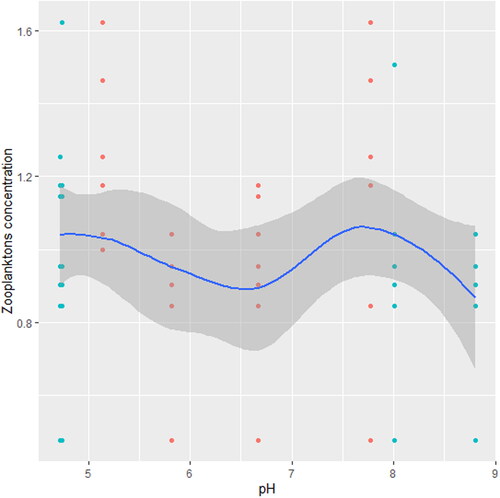
Figure 6. Zooplankton in relation to turbidity in station A, n = 594.
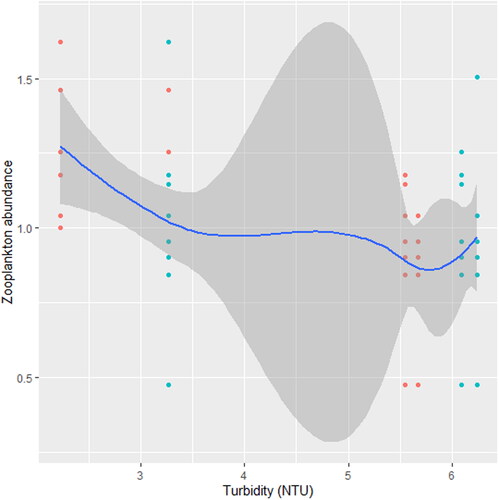
Figure 7. Zooplankton in relation to pH in station B, n = 807.
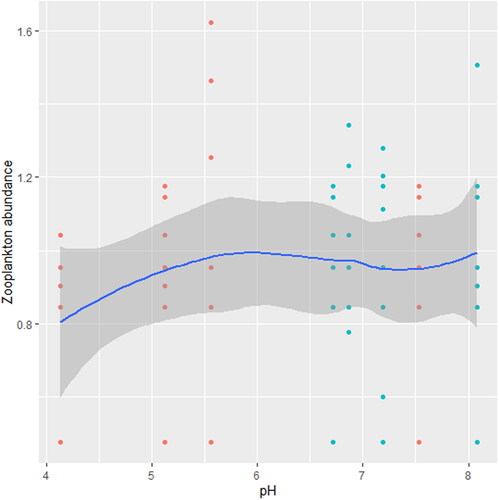
Figure 8. Zooplankton in relation to temperature in station B, n = 807.
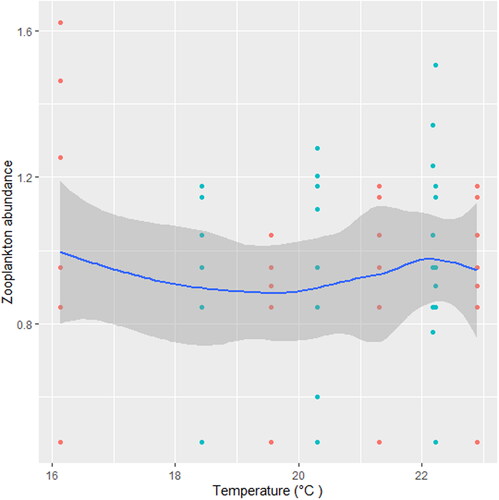
Figure 9. Zooplankton in relation to turbidity in station B, n = 807.
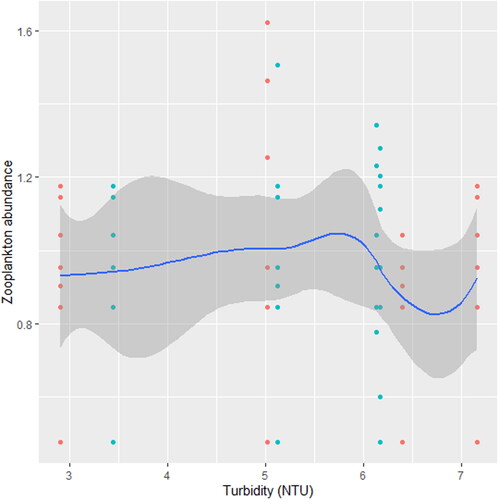
Figure 10. Zooplankton relation to phosphate in station B, n = 807.
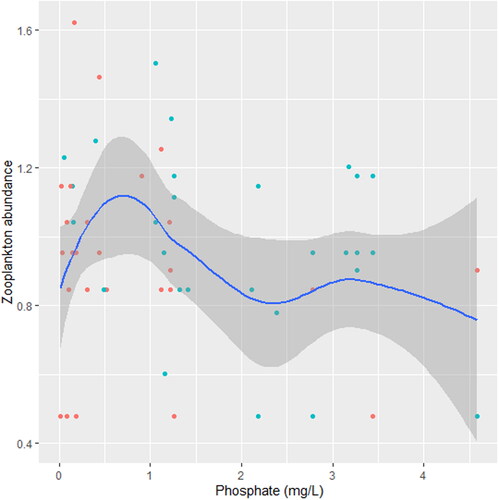
Figure 11. Zooplankton relation to nitrate in station B, n = 807.
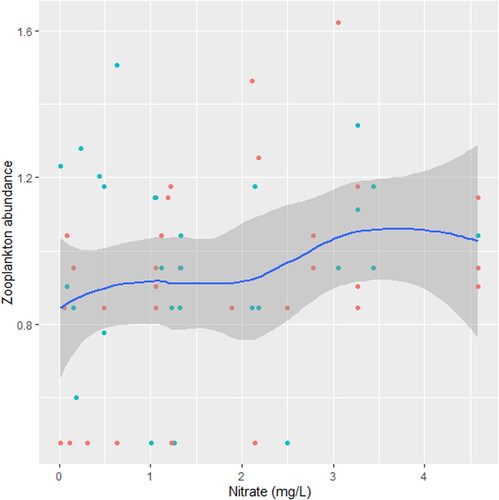
Figure 12. Zooplankton in relation to DO in station B, n = 807.
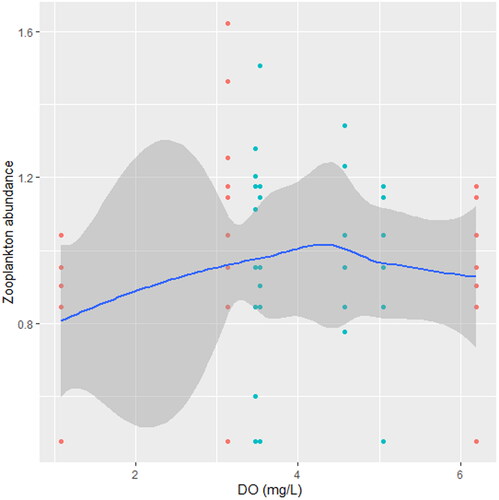
Figure 13. Zooplankton in relation to temperature in station C, n = 818.
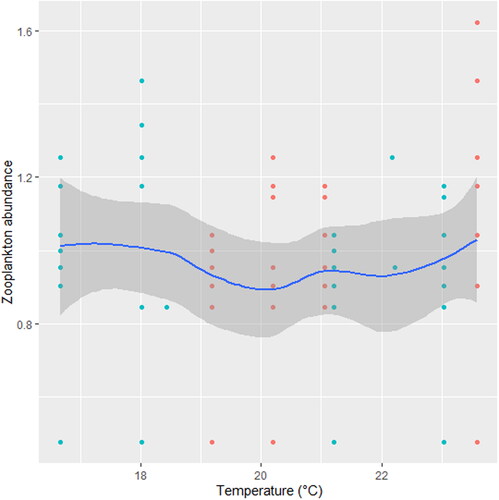
Figure 14. Zooplankton in relation to turbidity in station C, n = 818.
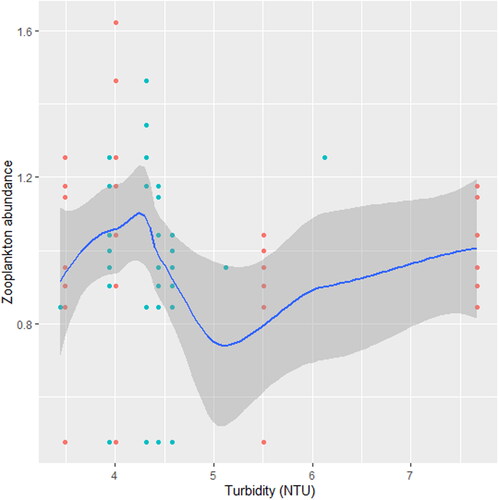
Figure 15. Zooplankton in relation to phosphate in station C, n = 818.
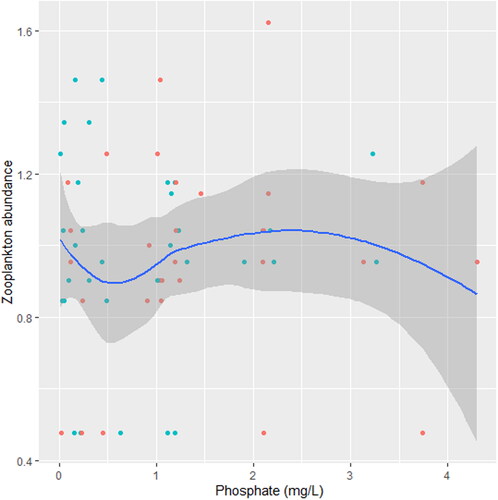
Figure 16. Zooplankton in relation to nitrate in station C, n = 818.
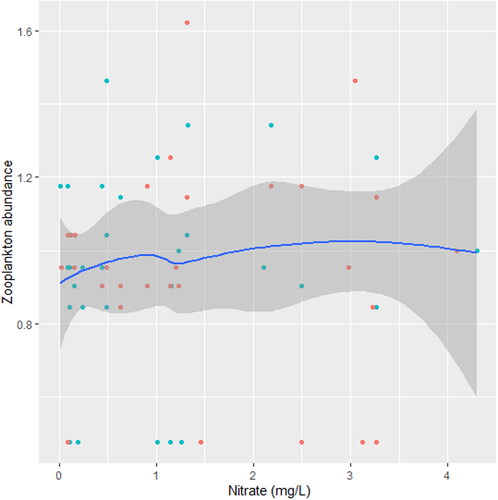
Figure 17. Zooplankton in relation to DO in station C, n = 818.