
Figures & data
Figure 1. The location of sampling stations in study area.
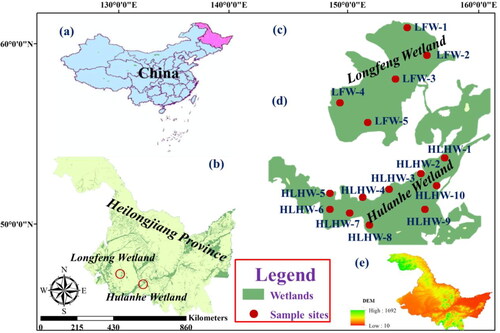
Table 1. Geographic position, main morphometric features, environmental information and city of two wetlands.
Table 2. Mean and standard deviation of physical chemistry factors in two wetlands during the study period.
Figure 2. Spatial and temporal variation of total phytoplankton abundance in each wetland and hydrological period during the study period (LF: Longfeng wetland, HLWH: Hulanhe wetland).
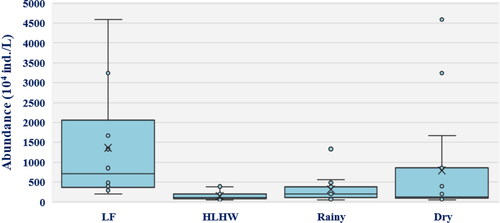
Figure 3. Spatial and temporal variation of the relative proportion of the different functional approaches (in abundance) in two wetlands during the study period (LF-R: sample station of Longfeng wetland in Rainy season, LF-D: sample station of Longfeng wetland in Dry season, HLHW-R: sample station of Hulanhe wetland in Rainy season, HLHW-D: sample station of Hulanhe wetland in Dry season).
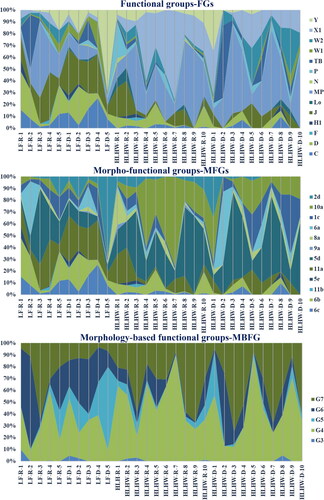
Figure 4. First and second axes of the RDA based on the abundance of the functional groups (FGs) (a and b), Morpho-functional groups (MFGs) (c and d) and Morphology-based functional groups (MBFGs) (e and f) on the Longfeng wetland and Hulanhe wetland.
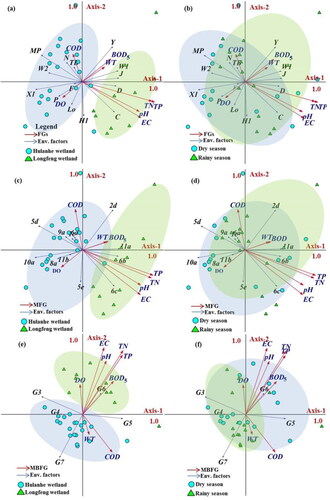
Table 3. Relative proportion of the descriptors species and their respective functional groups in two wetlands during study period.
Table 4. Summary statistics of Redundancy analysis in FGs, MFGs and MBFG.
Table 5. Results of the Monte Carlo test permutation test in FGs, MFGs and MBFG.
Data availability statement
The processed data required to reproduce these findings cannot be shared at this time as the data also forms part of an ongoing study.