
Figures & data
Figure 1. Location of Changhu Lake and four sampling sites in Hubei province, central China.
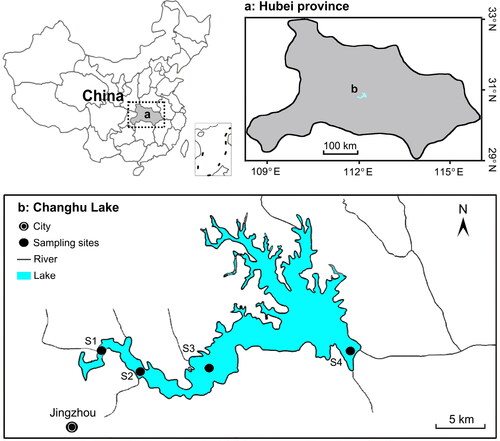
Figure 2. Extreme water level events recorded over the full time series in Changhu Lake. LWL, extremely low water level event; HWL, extremely high water level event.
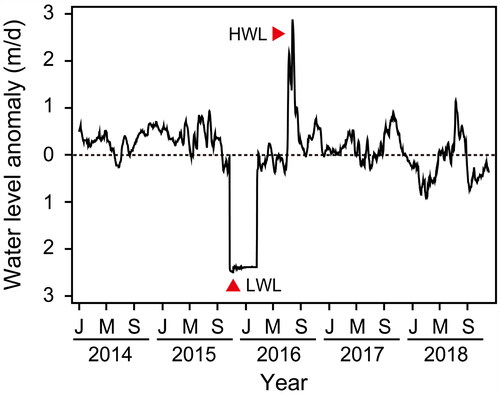
Figure 3. Spatial and annual variations of (a) total nitrogen (TN), (b) ammonia nitrogen (NH4-N), (c) total phosphorus (TP), and (d) chemical oxygen demand (CODMn) in Changhu Lake.
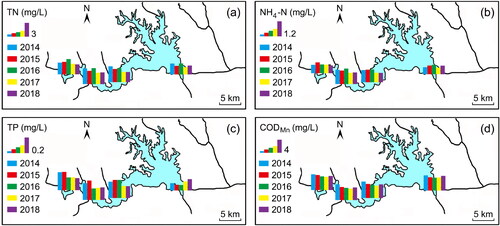
Table 1. Mean and standard deviation (SD) for several nutrient parameters investigated in Changhu Lake, and significance results of ANOVA test between 5 years (2014–2018).
Figure 4. Spatial and monthly variations of (a) total nitrogen (TN), (b) ammonia nitrogen (NH4-N), (c) total phosphorus (TP), and (d) chemical oxygen demand (CODMn) in Changhu Lake.
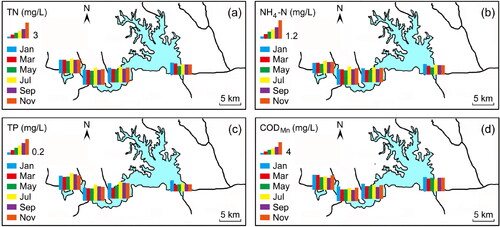
Table 2. Mean and standard deviation (SD) for several nutrient parameters investigated in Changhu Lake, and significance results of ANOVA test between 6 months (2014–2018).
Table 3. Mean and standard deviation (SD) for several nutrient parameters investigated in Changhu Lake, and significance results of ANOVA test between the four sites (2014–2018).
Figure 5. Non-metric multidimensional scaling (MDS) plots of nutrient parameters in Changhu Lake for different (a) years, (b) months, (c) sampling sites, and (d) phases related to the extreme water levels. Before, samples from January 2014 to September 2015; After, samples from November 2015 to July 2016; Present, samples from September 2016 to November 2018.
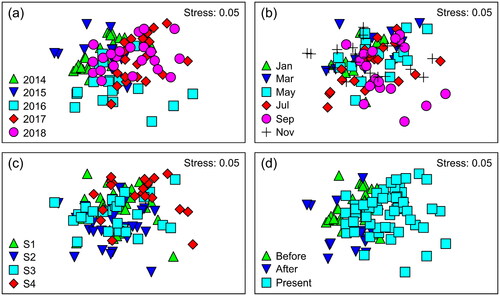
Figure 6. Time series of (a) total nitrogen (TN), (b) ammonia nitrogen (NH4-N), (c) total phosphorus (TP), and (d) chemical oxygen demand (CODMn) in Changhu Lake. LWL, extremely low water level event; HWL, extremely high water level event.
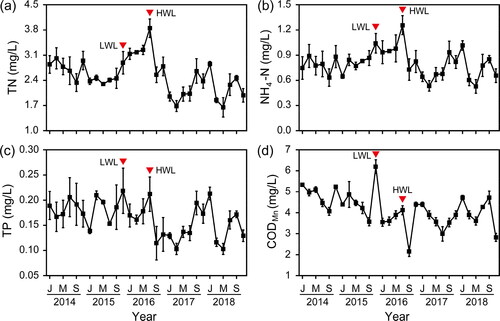
Figure 7. (a) total nitrogen (TN), (b) ammonia nitrogen (NH4-N), (c) total phosphorus (TP), and (d) chemical oxygen demand (CODMn) in Changhu Lake during different phases related to the extreme water levels. Before, samples from January 2014 to September 2015; After, samples from November 2015 to July 2016; After, samples from September 2016 to November 2018.
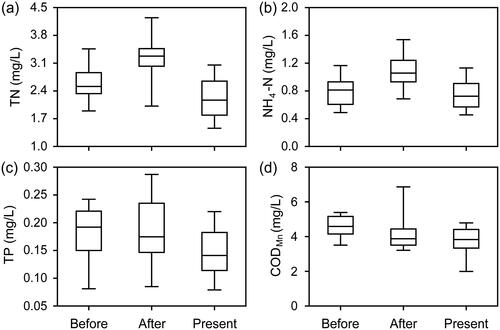
Table 4. Minimum, maximum, median, mean, standard deviation (SD), and number of values (n) for several nutrient parameters during the three periods related to extreme water levels in Changhu Lake from 2014 to 2018.
Figure 8. Principal component analysis of nutrient parameters (solid lines with arrowhead) in Changhu Lake. The samples from January 2014 to September 2015 are shown as black (Before), the samples from November 2015 to July 2016 as red (After), and the samples from September 2016 to November 2018 as green (Present). TN, total nitrogen; NH4-N, ammonia nitrogen; TP, total phosphorus; CODMn, chemical oxygen demand.
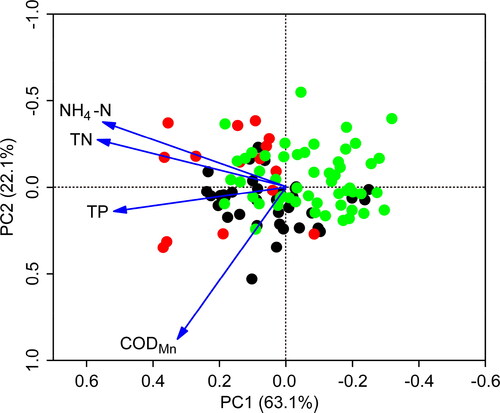
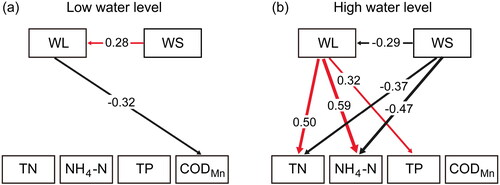
Figure 9. Path diagrams showing how water levels affect nutrient parameters in Changhu Lake. Results derive from Pearson correlation coefficient analysis. The values along the pathways represent Pearson correlation coefficients, and arrow thickness is proportional to the correlation coefficients. Pathways were selected only if p < 0.05. Red arrows represent positive relationships, and black arrows represent negative relationships. TN, total nitrogen; NH4-N, ammonia nitrogen; TP, total phosphorus; CODMn, chemical oxygen demand; WL, water level; WS, wind speed.
Data availability statement
The data that support the findings of this study are openly available in figshare at http://doi.org/10.6084/m9.figshare.17213135.