
Figures & data
Table 1. Commercial and recreational length-based fishing regulations (mm) for channel catfish on the Illinois River and studied sections of the Mississippi, Ohio, and Wabash rivers.
Figure 1. Map of the Illinois River and sections of the Mississippi, Ohio, and Wabash rivers sampled during 2017–2018 under LTEF using DC electrofishing. Lock and dams are represented by bold black lines perpendicular to rivers, whereas different sampling areas in unimpounded reaches are represented by thin double lines.
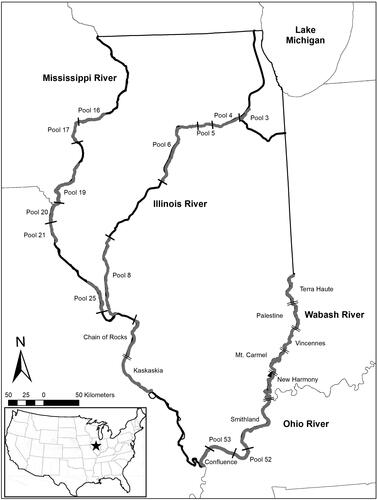
Table 2. Pools and reaches of the Illinois, Mississippi, Ohio, and Wabash rivers sampled by LTEF pulsed-DC electrofishing surveys during 2017–2018 with river kilometers (RKM), the number of sampling locations within each sample region (N), whether each pool/reach is impounded by a lock and dam (Y/N), and mean (± SE) annual discharge with gauging station.
Figure 2. Length frequency histograms (10 mm total length bins) for channel catfish that were collected during 2017–2018 in the Illinois River and sections of the Mississippi, Ohio, and Wabash rivers. Total fish collected (N) and mean total length for each river.
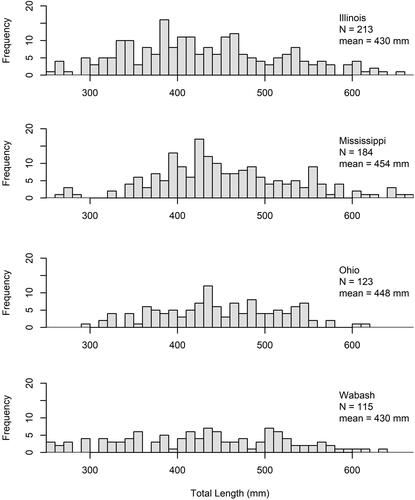
Table 3. von Bertalanffy growth coefficients with 95% confidence intervals by river location for channel catfish and freshwater drum collected in 2017 and 2018 (L∞ = maximum length (mm), K = growth coefficient (years-1), and t0 = theoretical age at length 0).
Table 4. Population age range and initial and maximum ages used for the descending limb of the catch curve in the mortality analyses for 2017–2018 channel catfish and freshwater drum from four Midwestern large rivers.
Figure 3. Graphs of von Bertalanffy models for channel catfish sampled with DC electrofishing during 2017–2018 in the Illinois River and sections of the Mississippi, Ohio, and Wabash rivers. See text and for parameters and parameter descriptions.
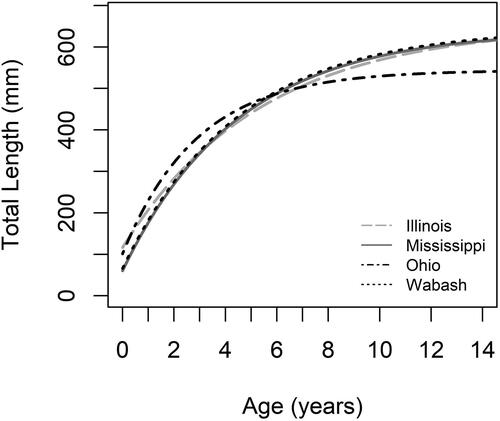
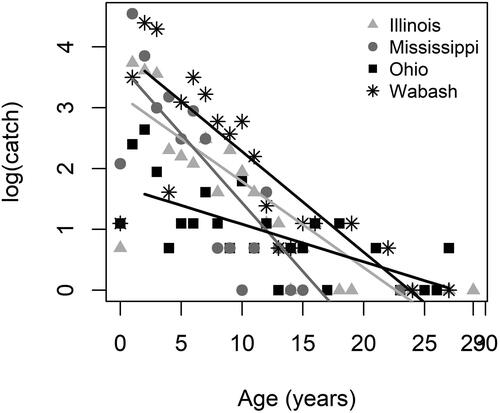
Figure 4. Catch curves for channel catfish sampled with DC electrofishing during 2017–2018 in the Illinois River and sections of the Mississippi, Ohio, and Wabash rivers. Ages used for regression are shown in (Illinois r2 = 0.95; Mississippi r2 = 0.96; Ohio r2 = 0.79; Wabash r2 = 0.92).
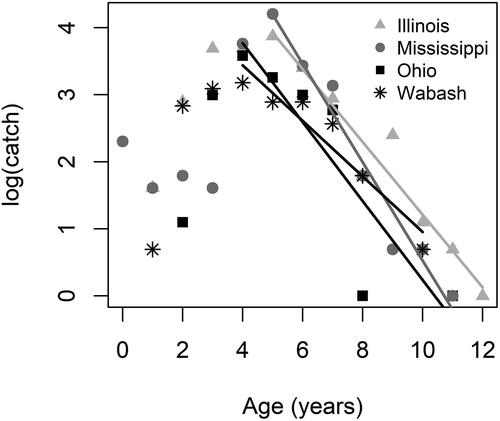
Figure 5. Length frequency histograms (10 mm total length bins) for freshwater drum that were collected during 2017–2018 in the Illinois River and sections of the Mississippi, Ohio, and Wabash rivers. Total fish collected (N) and mean total length for each river.
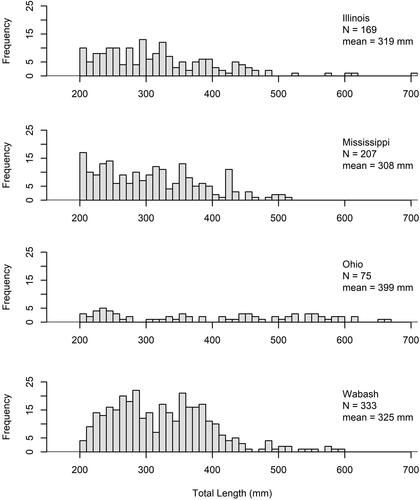
Figure 6. Graphs of von Bertalanffy models for freshwater drum sampled with DC electrofishing during 2017–2018 in the Illinois River and sections of the Mississippi, Ohio, and Wabash rivers. See text and for parameters and parameter descriptions.
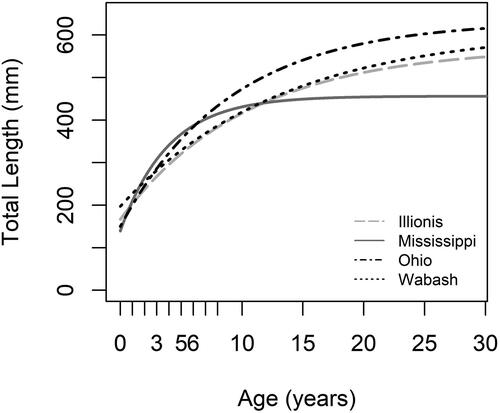
Figure 7. Catch curves for freshwater drum sampled with DC electrofishing during 2017–2018 in the Illinois River and sections of the Mississippi, Ohio, and Wabash rivers. Ages used for regression are shown in (Illinois r2 = 0.81; Mississippi r2 = 0.72; Ohio r2 =0.47; Wabash r2 = 0.76).
Data availability statement
The data that support the findings of this study are available on request from the corresponding author, ALW.