
Figures & data
Figure 1. Water temperature and air temperature during the experiment.
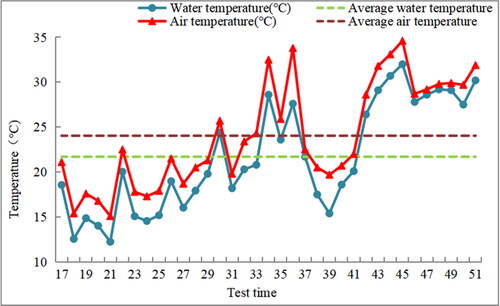
Figure 2. The changes of underwater light in experiment.
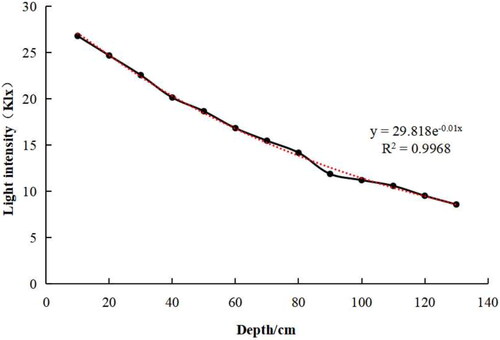
Figure 3. Schematic diagram of experiment design.
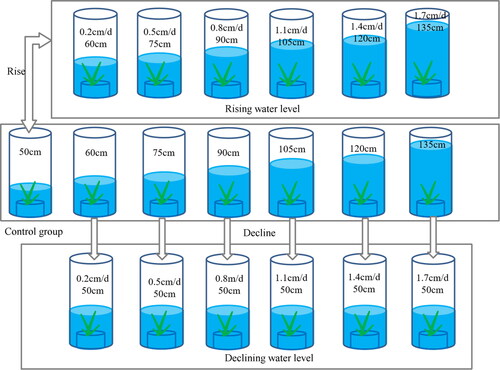
Figure 4. Effect of water level change on the plant height of V. natans. Different capital letters indicate the difference between the same change rate and different test times, and different lowercase letters indicate the difference between the same test time and different change rates.
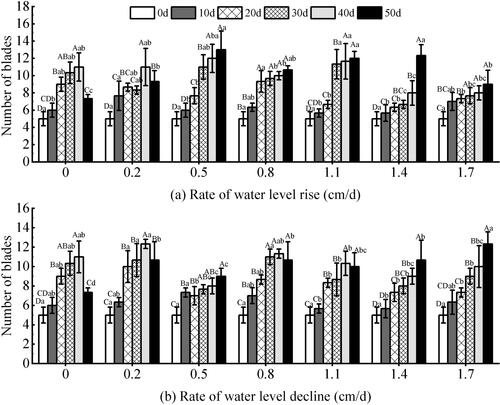
Table 1. Result of two-way analysis of variance (ANOVA) testing for main effects of water level change, time, and their interactions on V. natans (F-value).
Figure 5. Effect of water level change on the number of blades of V. natans. Different capital letters indicate the difference between the same change rate and different test times, and different lowercase letters indicate the difference between the same test time and different change rates.
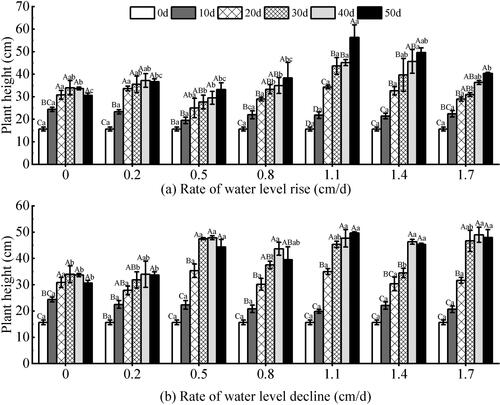
Figure 6. Effect of water level change on the Root activity of V. natans. Different capital letters indicate the difference between the same change rate and different test times, and different lowercase letters indicate the difference between the same test time and different change rates.
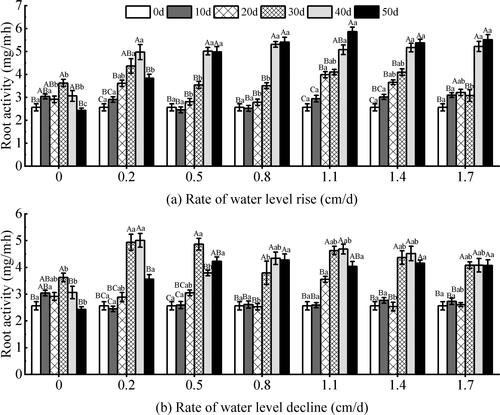
Figure 7. Effect of water level change on the biomass of V. natans. AGB: above-ground biomass. BGB: below-ground biomass. Different capital letters indicate the difference between the same change rate and different test times, and different lowercase letters indicate the difference between the same test time and different change rates.
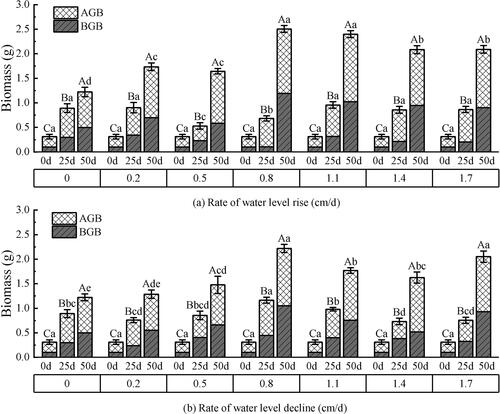
Figure 8. Effect of water level change on chlorophyll a (Chl a) of V. natans. Different capital letters indicate the difference between the same change rate and different test times, and different lowercase letters indicate the difference between the same test time and different change rates.
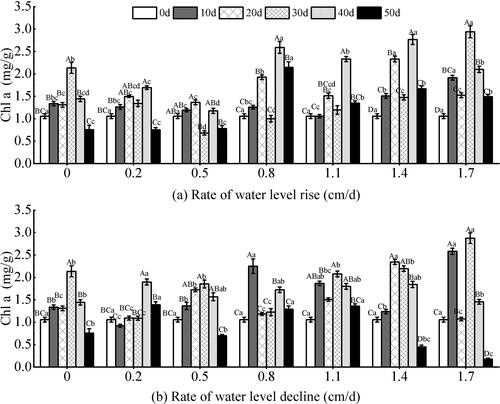
Figure 9. Effect of water level change on chlorophyll b (Chl b) of V. natans. Different capital letters indicate the difference between the same change rate and different test times, and different lowercase letters indicate the difference between the same test time and different change rates.
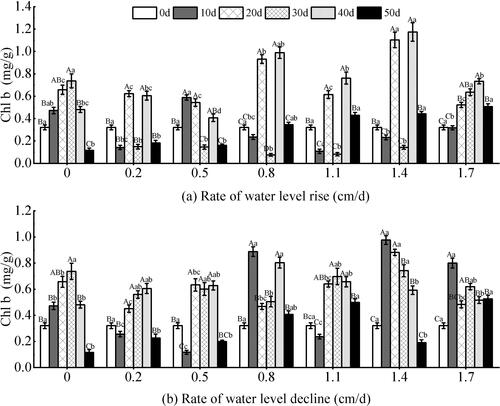
Figure 10. Effect of water level change on chlorophyll (a + b) (Chl a + b) of V. natans. Different capital letters indicate the difference between the same change rate and different test times, and different lowercase letters indicate the difference between the same test time and different change rates.
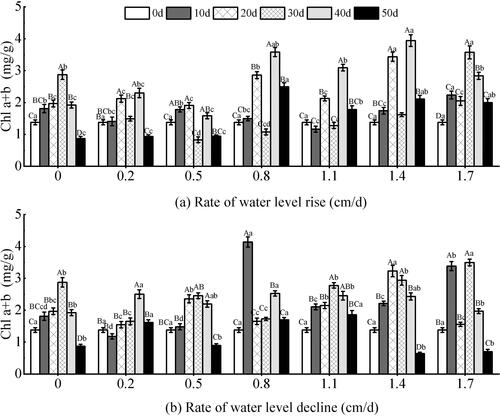
Figure 11. Effect of water level changes on carotenoid (Car) of V. natans. Different capital letters indicate the difference between the same change rate and different test times, and different lowercase letters indicate the difference between the same test time and different change rates.
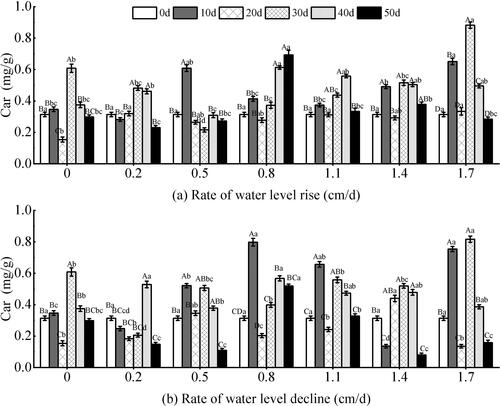
Figure 12. Effect of water level changes on soluble protein (SP) content of V. natans. Different capital letters indicate the difference between the same change rate and different test times, and different lowercase letters indicate the difference between the same test time and different change rates.
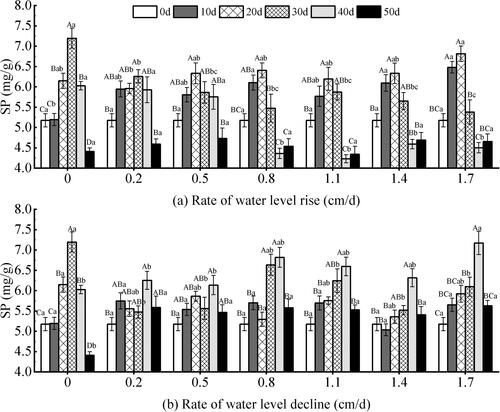
Figure 13. Effect of water level change on soluble sugar (SS) content of V. natans. Different capital letters indicate the difference between the same change rate and different test times, and different lowercase letters indicate the difference between the same test time and different change rates.
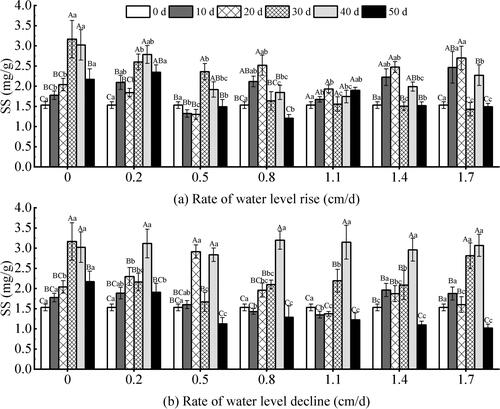
Table 2. Correlation analysis of morphological and physiological indexes of V. natans.