
Figures & data
Figure 1. Distribution of sampling sites in the main rivers around Taihu Lake.
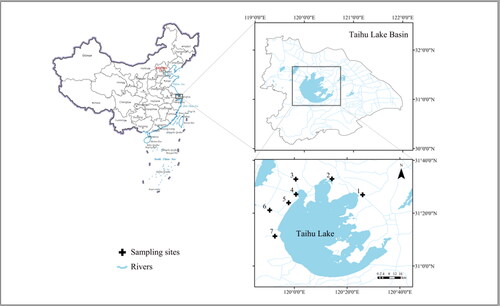
Table 1. Analytical performance parameters for the determination of GHGs.
Table 2. Physical and chemical parameters of sampling sites.
Figure 2. Concentrations of TN (a), TP (b), NO3−-N (c) and NH4+-N (d) in the overlying water.
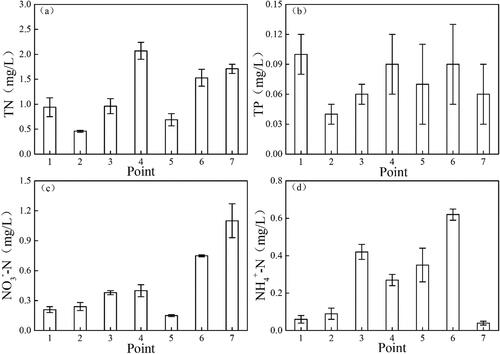
Figure 3. Concentrations of DTC (a), DIC (b) and DOC (c) in the overlying water.
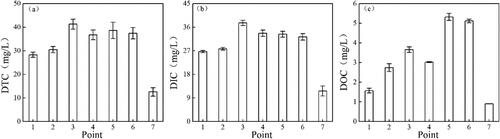
Figure 4. Concentrations of the greenhouse gases N2O (a), CH4 (b) and CO2 (c) in the overlying water.
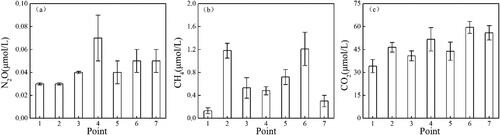
Table 3. Pearson’s correlation between the water quality indices and gas production.
Figure 5. Typical EEMs of DOM in the samples.
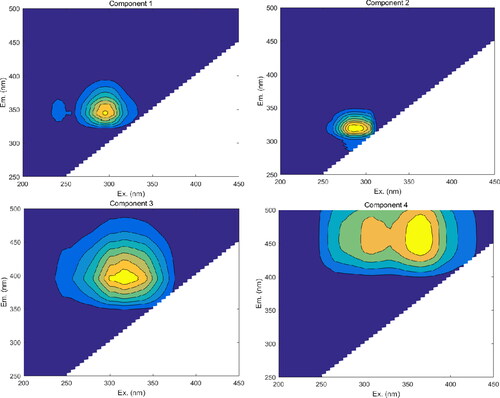
Table 4. Major fluorescence peaks and their spectral positions of dissolved organic matter in previous studies (Coble et al. Citation1998; Coble et al. Citation2014; Xi et al. Citation2018).
Figure 6. Comparison of UV and fluorescence characteristics of DOM.
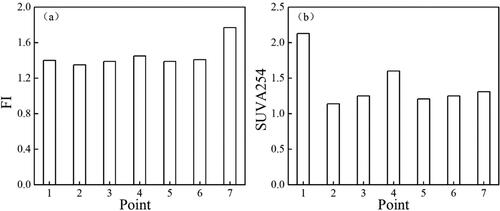
Table 5. Relationships between gas production and DOM composition.