
Figures & data
Figure 1. Map of sampling stations.
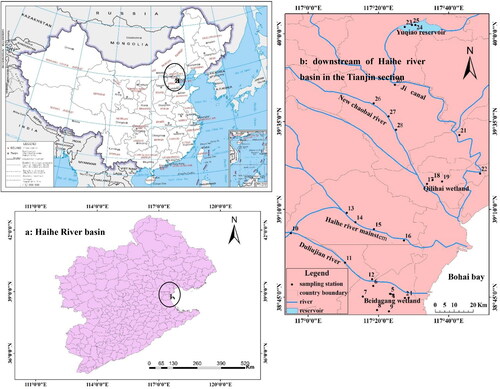
Table 1. Grading standards for freshwater trophic status.
Table 2. Directory of dominant phytoplankton species.
Table 3. Distribution characteristics of maximal abundance of dominant phytoplankton species in three surveys.
Table 4. Biomass and abundance of the phytoplankton community in the survey area.
Table 5. Species richness index d and biodiversity index H of the phytoplankton community in the survey area.
TABLE 6. Spatial distribution of TN and TP in the survey area.
TABLE 7. Spatial distribution of Chl-a and CODMn in the survey area.
Table 8. Linear regression equation fitted by assessment indices and fixed score.
Table 9. Spatial distribution characteristics of EI in the survey area.
Figure 2. Pearson correlation between the phytoplankton community parameters and the eutrophication assessment indices.
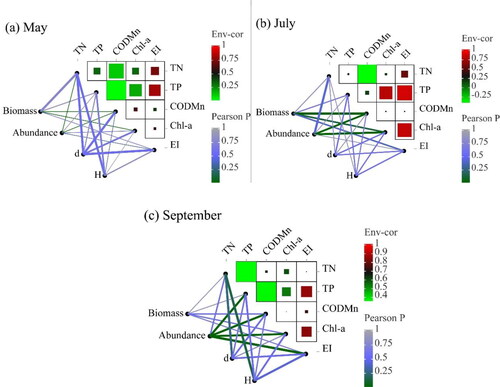
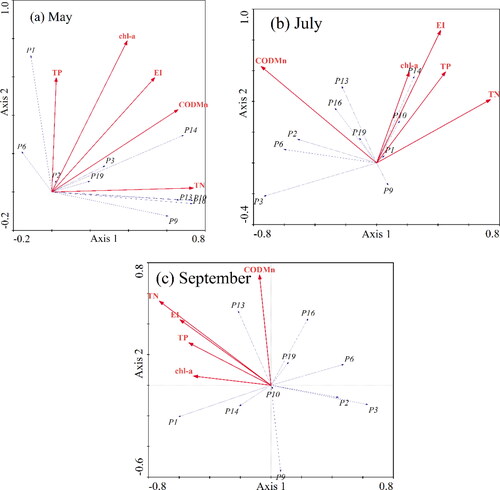
Figure 3. Ordination plot between the abundance of phytoplankton dominant species and the eutrophication assessment indices.
Data availability statement
The data that support the findings of this study are available from the first author, upon reasonable request.