
Figures & data
Figure 1. Study area maps. Left: Distribution of Dicamptodon spp. observations between San Francisco and the California-Oregon border reported on iNaturalist as of January 17, 2022. The study area corresponds to the gap in coastal observations outlined in black. Right: Survey sites included in this study (n = 29).
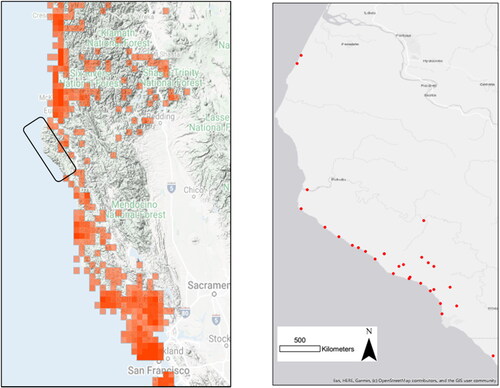
Table 1. List of species included in survey with the number of sites where each species was detected based on visual encounter surveys (VES) or eDNA sampling (eDNA).
Figure 2. Estimated stream occupancy and upper 95% confidence limit of four most commonly observed aquatic amphibian species in the King Range National Conservation Area, California.
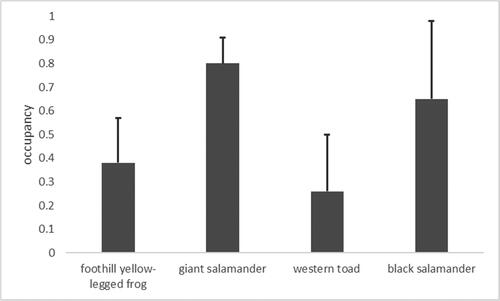
Table 2. Comparison table for occupancy and detection models of the four most commonly observed species in the King Range National Conservation Area; foothill yellow-legged frog, coastal/California giant salamander, western toad, and black salamander.
Table 3. Most supported occupancy and detection models for the four most commonly observed species in the King Range National Conservation Area; foothill yellow-legged frog, coastal/California giant salamander, western toad, and black salamander.
Data availability
All data used in this study available upon request to the authors.