
Figures & data
Figure 1. Geographical location of wetlands and sampling points in the Atlántico Department. A. Totumo (TM); B. Mallorquín(MQ); C. Sabanagrande (SG); D. La Larga-Luisa (LL); E. Tocagua (TG); F. Luruaco (LU).
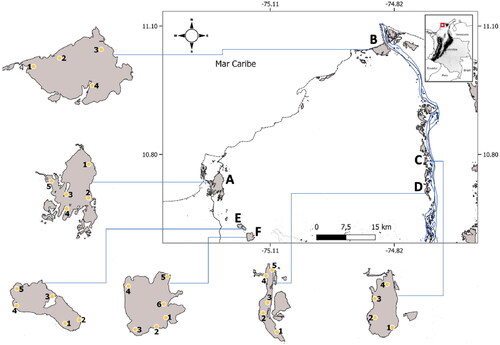
Table 1. Physicochemical characteristics of wetlands with different types of water influence.
Figure 2. Precipitation levels during sampling months, taken from the meteorological stations closer to the sampled wetlands (Hibacharo, E. Cortissoz y Flores).
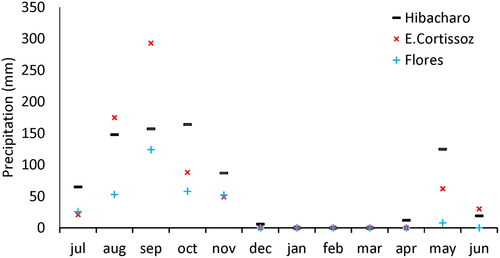
Figure 3. Abundance of M. marcella larvae in sampled wetlands: Larga-Luisa (LL), Luruaco (LU), Mallorquín (MQ), Sabanagrande (SG), Tocagua (TG), and Totumo (TM).
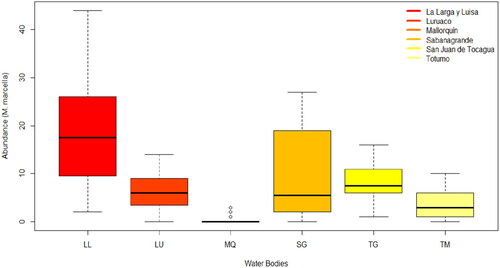
Figure 4. Intraannual variation of M. marcella larvae in sampled wetlands.
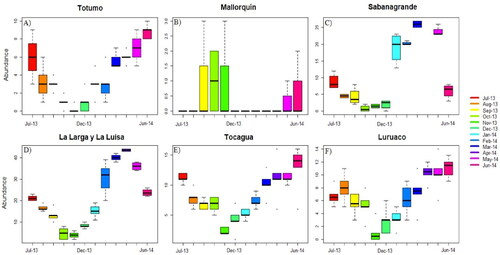
Figure 5. Spatial variation of M. marcella larvae in sampled wetlands.
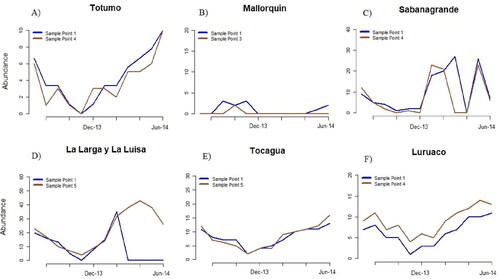
Figure 6. Conglomerate analysis of M. marcella larvae abundance in sampled wetlands.
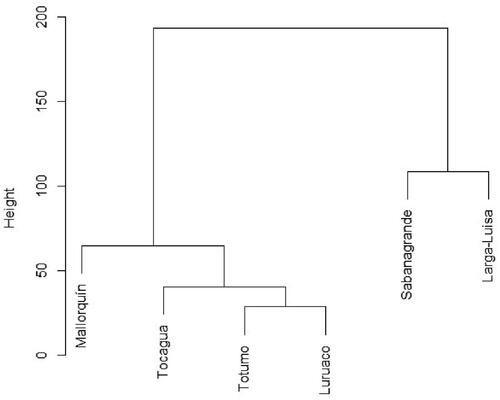
Table 2. Multiple linear regression models’ coefficients and p-values.
Supplemental Material
Download MS Word (14.5 KB)Data availability statement
The data that support the findings of this study are available on request from the corresponding author, Moreno M. The data are not publicly available due to privacy/ethical restrictions.