
Figures & data
Figure 1. Two distinct models of the infection cycle of human noroviruses examined in this study. (A) Human-origin model of food poisoning of marine bivalves by noroviruses. The infection is sourced from insufficiently treated sewage water. (B) Animal-sourced model of norovirus in marine bivalves. The sewage sludge is well-treated using incineration, particularly in current developed countries. The norovirus is persistently provided by unknown animal activities that occur cyclically or seasonally.
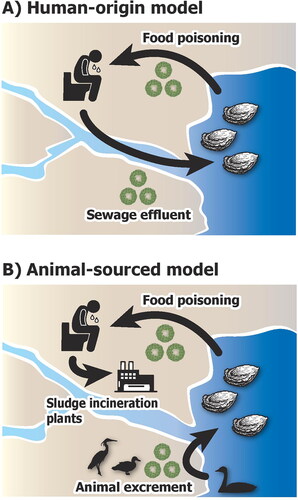
Figure 2. Detection of human norovirus and animal environmental DNA during the time course of norovirus epidemic season in the Miyagi Prefecture. Maps in the upper part of the figure depict the coastal area of the Miyagi Prefecture, Japan. Green and magenta dots indicate the RT-PCR-based detection of human norovirus (HNV) from cultured oysters of Matsushima Bay (MS) and other points, respectively. The upper 1st and 2nd rows present the number of HNV-positive assayed samples in all regions (green and magenta dots) and MS (green dots), respectively. Table S1 provides the details. Remaining rows show animal species detected from environmental DNA and their sequence counts from the MS. Figure S1 depicts the phylogenetic tree of avian used for correction of the species annotation. Columns correspond to the date analyzed at approximately one-week intervals. Green and magenta shading indicate the levels of detection strength.
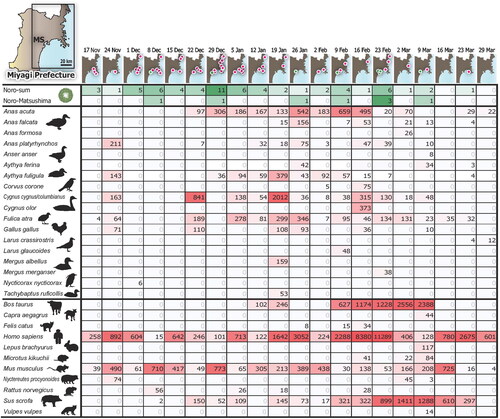
Table 1. Cross-correlation between detection cycle of animals based on absolute sequence numbers of environmental DNA metabarcoding and that of human norovirus from cultured oysters using RT-PCR-based assay at Matsushima Bay.
Table 2. Cross-correlation between detection cycle of animals based on relative sequence numbers (CPM) of environmental DNA metabarcoding and that of human norovirus from cultured oysters using RT-PCR-based assay at Matsushima Bay.
Supplemental Material
Download Zip (699.8 KB)Data availability statement
The raw sequence reads generated by the MiSeq in the current study are available in the DDBJ Sequence Read Archive (DRA) under the accession number DRA014474 for vertebrate mitochondrial 12S rRNA metabarcoding data. All relevant data are within the manuscript and its Supplementary information files.