
Figures & data
Figure 1. Map of the Chicago Area Waterway System (T.J. O’Brien, Lockport, and Brandon Road pools) to Lake Michigan, upper Illinois River (Dresden Island, Marseilles, and Starved Rock pools), and lower Illinois River (Peoria, La Grange, and Alton pools) sections of the Illinois Waterway sampled during 2019–2022 under the Multi-Agency Monitoring program. Locks and dams on the Illinois Waterway are represented by square symbols separating the navigational pools.
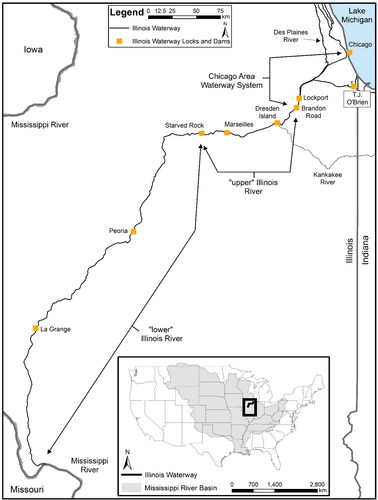
Table 1. Target effort for each sampling gear, sampling time period, and habitat type (MCB = main-channel border, SCB = side-channel border, BWC = backwater (fully contiguous) for each Pool of the Illinois Waterway.
Figure 2. Map of 2019–2022 Round goby captures from Lockport, Brandon Road, and Dresden Island pools of the Illinois Waterway. Note that RM stands for river mile.
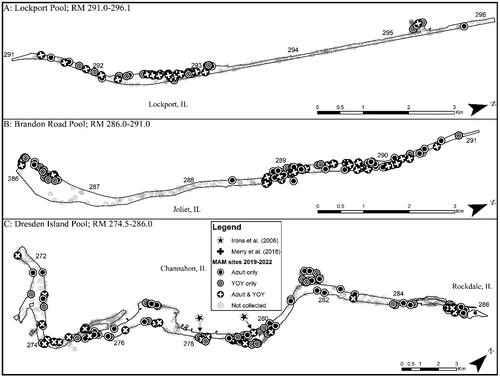
Figure 3. Map of 2019–2022 Round goby captures from Marseilles and Starved Rock pools of the Illinois Waterway. Note that RM stands for river mile.
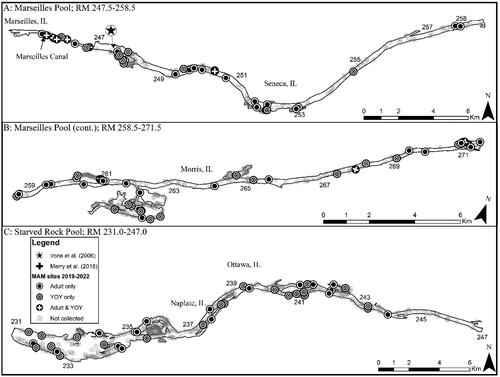
Figure 4. Map of 2019–2022 Round goby captures from Peoria Pool of the Illinois Waterway. Note that RM stands for river mile.
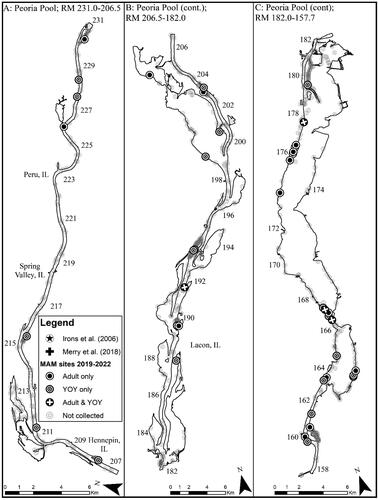
Figure 5. Map of 2019–2022 Round goby captures from La Grange Pool of the Illinois Waterway. Note that RM stands for river mile.
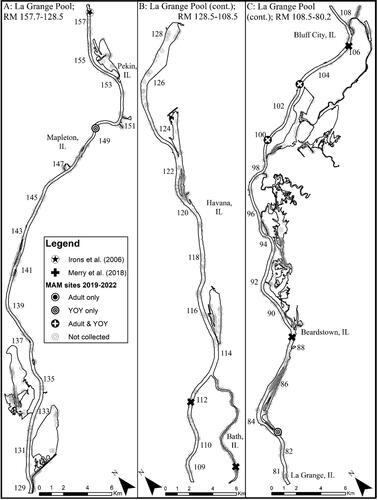
Figure 6. Map of 2019–2022 Round goby captures from Alton Pool of the Illinois Waterway. Note that RM stands for river mile.
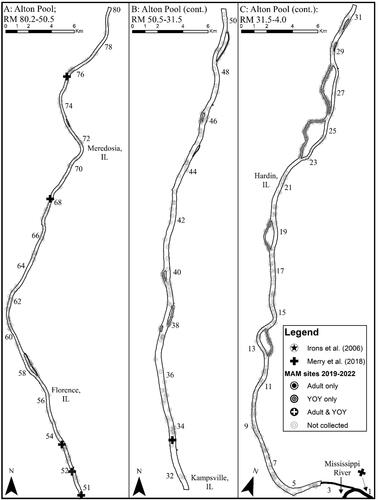
Table 2. Sampling effort (Total sites), total catch of Round goby (Total RDGY), frequency of occurrence (Occurrence [%]), and mean catch-per-unit-effort (Mean CPUE ± SE) for each Pool of the Illinois Waterway by year. Also included is the ratio of the number of sites at which we captured ‘adults’ only to the number of sites at which we captured ‘YOY’ only (adult-only:YOY-only); undefined ratios (i.e. with a zero denominator) are indicated by (und.).
Figure 7. Round goby catch-per-unit-effort (CPUE) across the eight navigational pools of the Illinois Waterway. The circles representing CPUE values are offset to reduce overlap.
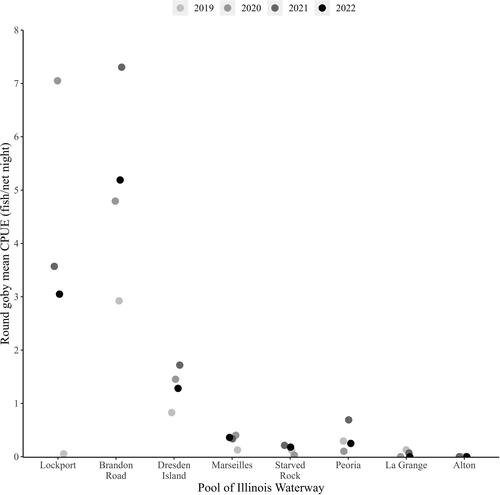
Figure 8. Round goby frequency of occurrence (%) across the eight navigational pools of the Illinois Waterway. The circles representing frequency of occurrence values are offset to reduce overlap.
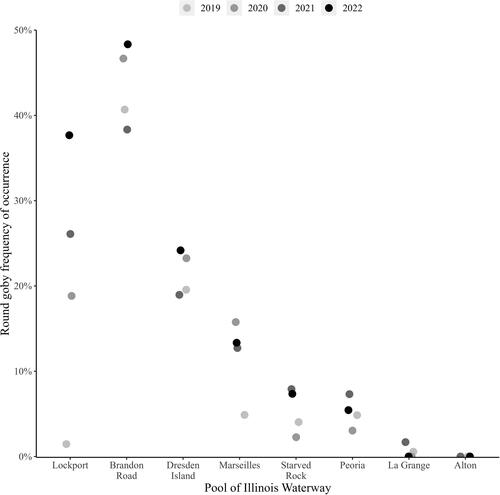
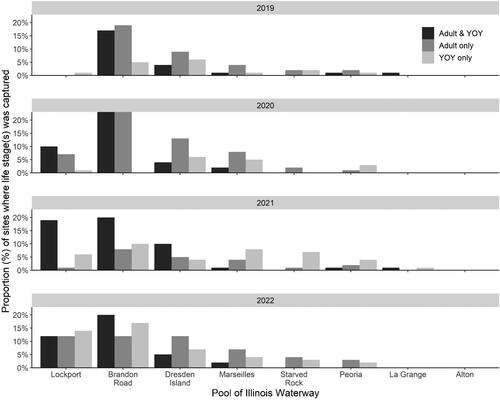
Figure 9. The proportion of sites where only adult (adult only), adult and young-of-year (adult and YOY), and only YOY (YOY only) Round goby were captured in all pools of the IWW from 2019 to 2022.
Supplemental Material
Download MS Word (127.9 KB)Data availability statement
These data that support the findings of this study are available from the corresponding author [BSH] upon request.