
Figures & data
Figure 1. Distribution of sampling locations in Chengdong Lake in the present study. MD = macrophyte-dominated zones, AD = algae-dominated zones.
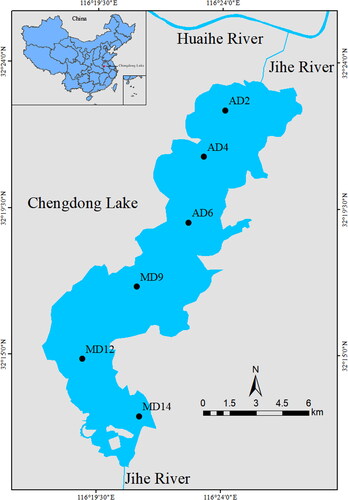
Figure 2. Physicochemical properties of the water and sediment in different regions of Chengdong Lake. (a) Total nitrogen in the water, (b) total phosphorous in the water, (c) Chl a in the water, (d) total nitrogen in the sediment, (e) total phosphorous in the sediment, (f) total organic matter in the sediment, (g) pH in the water, and (h) pH in the sediment. Abbreviations: ADW, lake water from the algae-dominated zones; ADS, sediment from the algae-dominated zones; MDW, lake water from the macrophyte-dominated zones; MDS, sediment from the macrophyte-dominated zones.
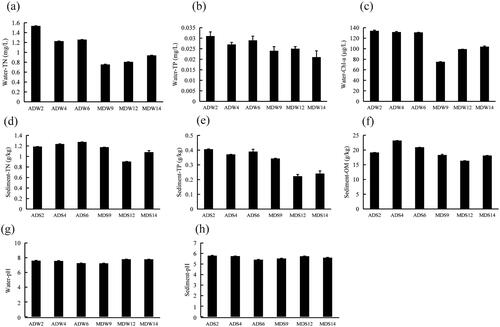
Table 1. Bacterial richness and diversity of the bacterial community in water and sediments of different regions.
Figure 3. Analysis of the relative abundance at the phylum level of the bacterial community in the water bodies and sediment of Chengdong Lake.
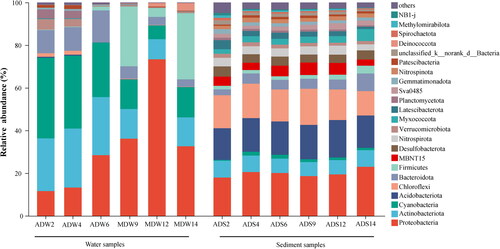
Figure 4. Ordination plot showing the grouping of samples from the different lake regions according to their bacterial community structure, the principal coordinates analysis was based on the Bray-Curtis dissimilarity matrix. (a) water samples, (b) sediment samples, (c) water and sediment samples.
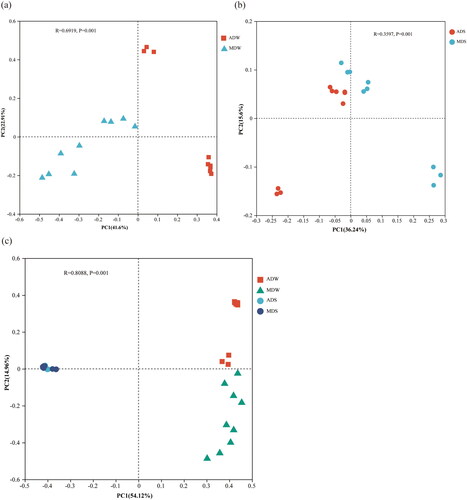
Figure 5. db-RDA ordination diagram of bacterial communities associated with environmental variables in the (a) water and (b) sediments of Chengdong Lake. Chl-a chlorophyll-a, TP total phosphorus, TN total nitrogen, pH in the water; OM organic matter, TP total phosphorus, pH in the sediment.
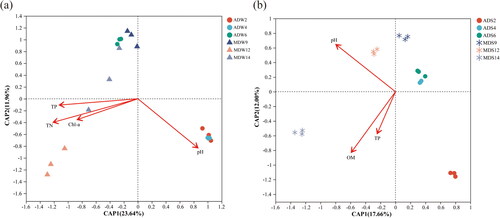
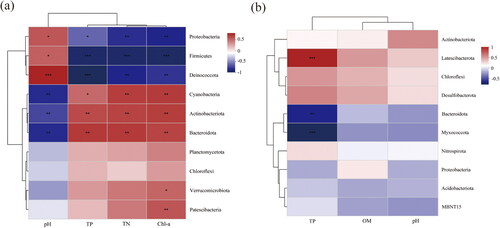
Figure 6. Heat map showing correlation analysis between bacterial communities and physiochemical parameter: (a) water, (b) sediment samples. * p < 0.05, **p < 0.01, ***p < 0.001.
Data availability statement
All data generated or analyzed during this study are included in this published article. The 16S rRNA gene sequences obtained in this study have been submitted to the NCBI SRA database under accession numbers PRJNA1019119 (water samples) and PRJNA1019121 (sediment samples).