Figures & data
Table 1. List of QRT-PCR primers
Figure 1. Expression of α2-ADRs in MIO-M1 human Müller cells.
Fluorescence micrographs of immunocytochemistry for (A, B) α2A-ADR, (C, D) α2B-ADR, (E) α2C-ADR, and (A–E) the Müller cell markers, GS and CRALBP. (F) qRT-PCR analysis of α2-ADR mRNA levels in MIO-M1 Müller cell culture. Bar graph shows normalized mRNA levels relative to β-actin for CRALBP, α2A-ADR, α2B-ADR and α2C-ADR mRNA in MIO-M1 Müller cell line. Bar graph is mean ± SEM, n = 6. Scale bar in (E) is 30 μm; valid also for (A–D).
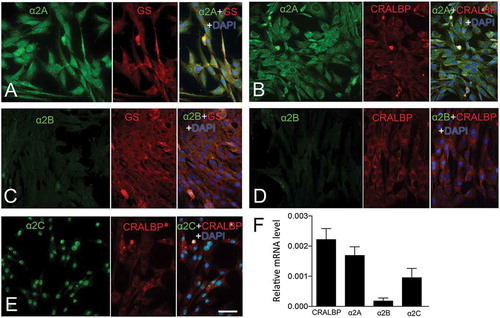
Figure 2. Brimonidine (BMD) treatment phosphorylates ERK1/2 in MIO-M1 human Müller cells.
(A) Experimental outline. Serum-starved MIO-M1 cells were treated with 300 μM BMD and analyzed at 0 min up to 180 min time points. (B–G) Fluorescence micrographs showing immunocytochemistry for P-ERK1/2, green and the Müller cell markers GS and CRALBP, red at (B, C) 0 min, (D, E) 60 min, and (F, G) 180 min time points after BMD treatment. (H) Western blot analysis of P-ERK1/2 levels in BMD-treated MIO-M1 Müller cells. (I) Bar graph with densitometry of P-ERK1/2 levels normalized by total ERK1/2 levels. Bar graph is mean ± SEM, n = 3 (*P < 0.01, **P < 0.001, ***P < 0.0001) analyzed by one-way ANOVA and Tukey’s post hoc test. Scale bar in (G) is 30 μm; valid also for (B–F). Significance is only indicated for comparisons: BMD 0 min–BMD 10, 30 and 60 min.
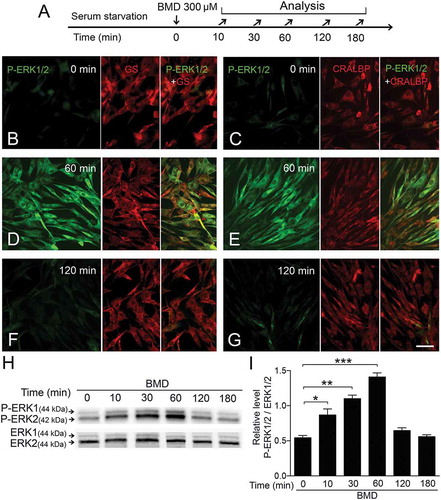
Figure 3. Brimonidine (BMD) treatment induces phosphorylation of AKT in MIO-M1 human Müller cells.
(A) Experimental outline. Serum-starved MIO-M1 cells were treated with 300 μM BMD and analyzed at 0 min up to 180 min time points. (B) Western blot analysis of P-AKT (Thr-308) levels in BMD-treated MIO-M1 cells. (C) Bar graph with densitometry of P-AKT (Thr-308) levels normalized by AKT (Pan) levels. Bar graph is mean ± SEM, n = 3 (**P < 0.001, ***P < 0.0001) analyzed by one-way ANOVA and Tukey’s post hoc test. Significance is only indicated for comparisons: BMD 0 min–BMD 30 and 60 min.
Figure 4. Blocking of brimonidine (BMD)-induced P-ERK1/2 or P-AKT (Thr-308) in MIO-M1 human Müller cells by yohimbine treatment.
(A) Experimental outline. Serum-starved MIO-M1 cells pretreated with 100 μM yohimbine or control (vehicle) for 30 min followed by treated with 300 μM BMD or vehicle for 60 min. Western blot analysis of (B) P-ERK1/2 and (D) P-AKT (Thr-308) levels in BMD-treated MIO-M1 cells. Bar graphs with densitometry of (C) P-ERK1/2 levels normalized by total ERK1/2 levels, and (E) P-AKT (Thr-308) levels normalized by AKT (Pan) levels. Bar graph are mean ± SEM, n = 3 (***P < 0.0001) analyzed by one-way ANOVA and Tukey’s post hoc test. Significance is only indicated for the comparison: BMD 60 min–BMD + yohimbine 60 min.
Figure 5. Effects of EGFR kinase inhibitor AG1478 or EGFR-siRNA on brimonidine (BMD)-induced P-ERK1/2 or P-AKT (Thr-308) in MIO-M1 human Müller cells.
(A) Experimental outline. Serum-starved MIO-M1 cells pretreated with 100 μM AG1478 or control (vehicle) for 30 min followed by treatment with 300 μM BMD or vehicle for 60 min or with EGF 100 ng/mL or vehicle for 10 min. Western blot analyses of P-ERK1/2 levels in MIO-M1 cells treated with (B, C) BMD + AG1478 and (D, E) EGF + AG1478 and P-AKT (Thr-308) levels treated with (F, G) BMD + AG1478. Bar graph with densitometry of (C, E) P-ERK1/2 levels normalized to total ERK1/2 levels, and (G) P-AKT (Thr-308) levels normalized to AKT (Pan) levels. (H) MIO-M1 human Müller cells transfected with EGFR-siRNA or non-targeted siRNA (NT-siRNA) in absence of serum for 48 hours followed by treatment with 300 μM BMD or vehicle for 60 min. (I) Western blot analysis of P-ERK 1/2 and P-AKT (Thr-308) levels treated with BMD + EGFR-siRNA or BMD + NT-siRNA. Bar graph with densitometry of (J) P-ERK1/2 levels normalized to total ERK1/2 levels and (K) P-AKT (Thr-308) levels normalized to AKT (Pan) levels. Bar graphs are mean ± SEM, n = 3 (***P < 0.0001) analyzed by one-way ANOVA and Tukey’s post hoc test. Significance is only indicated for the comparisons: BMD 60 min–BMD + AG1478 60 min, EGF 10 min–EGF + AG1478 10 min, BMD 60 min–BMD + NT-siRNA 60 min and BMD 60 min–BMD + EGFR-siRNA 60 min.
Figure 6. Brimonidine (BMD) treatment phosphorylates the tyrosine 1173 residue (Y1173) of EGFR in MIO-M1 human Müller cells.
(A) Experimental outline. Serum-starved MIO-M1 cells treated with 300 μM BMD or control (vehicle), 100 ng/mL EGF and P-EGFR (Y1173) levels were analyzed at 0–180 min time points. Immunocytochemistry was performed on harvested cells 60 min after BMD or vehicle treatment and 10 min after EGF treatment. Fluorescence micrographs showing immunocytochemistry for phospho-Y1173 of the EGFR and for Müller cell marker GS on (B–D) control, and (E–G) BMD- and (H–J) EGF-treated cells. (K) Western blot analysis of P-EGFR (Y1173) levels in MIO-M1 cells at indicated time points after BMD treatment. (L) Bar graph with densitometry of P-EGFR (Y1173) levels normalized to total EGFR levels. Bar graph is mean ± SEM, n = 3 (*P < 0.01, **P < 0.001, ***P < 0.0001) analyzed by one-way ANOVA and Tukey’s post hoc test. Scale bar in (J) is 30 μm; valid also for (B–I). Significance is only indicated for comparisons: BMD 0 min–BMD 10, 30 and 60 min.
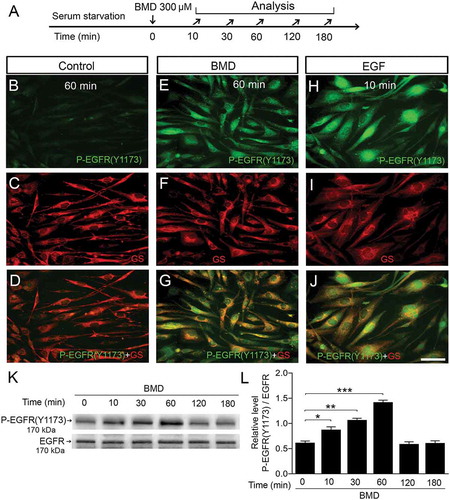
Figure 7. Effects of Src-kinase inhibitors PP1 and PP2 on brimonidine (BMD)-induced P-ERK1/2 or P-AKT (Thr-308) or P-EGFR (Y1173) in MIO-M1 human Müller cells.
(A) Experimental outline. Serum-starved MIO-M1cells pretreated with 5 μM PP1 or 5 μM PP2, or control (vehicle) for 20 min followed by treatment with 300 μM BMD or vehicle for 60 min or with 100 ng/mL EGF or vehicle for 10 min. Western blot analyses of (B–E) P-ERK1/2 levels, (F, G) P-AKT (Thr-308) levels and (H, I) P-EGFR (Y1173) levels in MIO-M1 Müller cells. Bar graphs with densitometry of (C, E) P-ERK1/2 levels normalized to total ERK1/2 levels and (G) P-AKT (Thr-308) levels normalized to AKT (Pan) levels and (I) P-EGFR (Y1173) levels normalized to total EGFR levels. Bar graphs are mean ± SEM, n = 3 (***P < 0.0001) analyzed by one-way ANOVA and Tukey’s post hoc test. Significance is only indicated for the comparisons: BMD 60 min–BMD + PP1 60 min, and BMD 60 min–BMD + PP2 60 min.
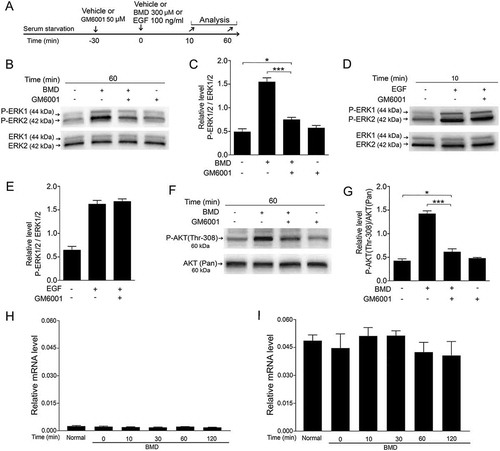
Figure 8. Effect of MMPs inhibitor GM6001 on BMD-induced ERK1/2 or AKT activation and expression of EGFR and its ligand HB-EGF in MIO-M1 human Müller cells.
(A) Experimental outline. Serum-starved MIO-M1 cells pretreated with 50 μM GM6001 or control (vehicle) for 30 min followed by treatment with 300 μM BMD or vehicle for 60 min or with 100 ng/mL EGF or vehicle for 10 min. Western blot analyses of P-ERK1/2 levels treated with (B) BMD + GM6001 and (D) EGF + GM6001 and P-AKT (Thr-308) levels in MIO-M1 cells. Bar graphs with densitometry of (C, E) P-ERK1/2 levels normalized to total ERK1/2 levels and (G) P-AKT (Thr-308) levels normalized to AKT (Pan) levels. (H, I) qRT-PCR analysis of HB-EGF and EGFR mRNA levels in normal and BMD-treated MIO-M1 cells. Serum-starved cells treated with 300 μM BMD or vehicle and analyzed at 0, 10, 30, 60 and 120 min time points. Bar graph shows normalized mRNA levels relative to β-actin for (H) HB-EGF and (I) EGFR mRNA. Bar graphs are mean ± SEM, n = 3 (*P < 0.01, **P < 0.001) analyzed by one-way ANOVA and Tukey’s post hoc test. Significance is only indicated for the comparisons: Control 60 min–BMD + GM6001 60 min, and BMD 60 min–BMD + GM6001 60 min.