Figures & data
Figure 1. Evaluation of cell morphology on porcine corneas and of pCEC cultures. (A) Porcine cornea stained with hypotonic Trypan Blue solution 0.04%. (B) Expression of ZO-1 detected via immunofluorescence on porcine corneal endothelium. (C) Expression of Na⁺/K⁺- ATPase detected via immunofluorescence on porcine corneal endothelium. (D) pCECs cultured at P2 upon FNC-coated glass coverslips and stained with hypotonic Trypan Blue solution 0.04%. (E) Expression of ZO-1 detected via immunofluorescence on pCECs cultured at P2 upon FNC-coated glass coverslips. (F) Expression of Na⁺/K⁺-ATPase detected via immunofluorescence on pCECs cultured at P2 upon FNC-coated glass coverslips. Scale bars: 100 µm.
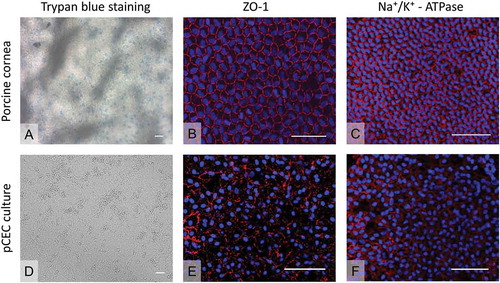
Figure 2. pCEC proliferation and viability at P2. (A) Evaluation of cell proliferation by expression of Ki67 (red, in white circles). Nuclei are stained by DAPI in blue. (B) Live-dead assay to determine cell viability (Blue: Live; Green, in circles: Dead). Scale bars: 100 µm.
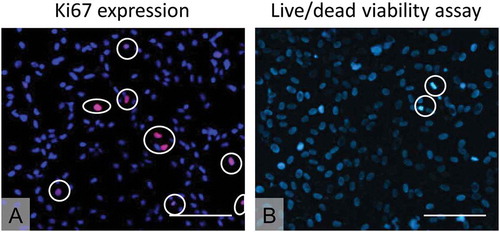
Figure 3. pCEC morphology at P2 on different biocompatible carriers. Series of illustrative figures showing successful pCEC cultures at P2 on chosen biocompatible membranes. (A) LK20, (B) LK100, (C) HALC. Scale bars: 100 µm.
Figure 4. pCEC morphology check at P2 through immunofluorescence on different carriers. (A, B, C) ZO-1 expression detected in pCECs cultured on LK20, LK100, and HALC, respectively. (D, E, F) Na+/K+ expression detected in pCECs cultured on LK20, LK100, and HALC, respectively. Scale bars: 100 µm.
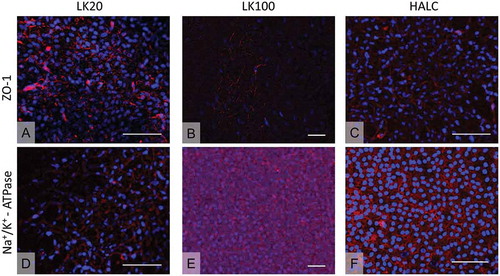
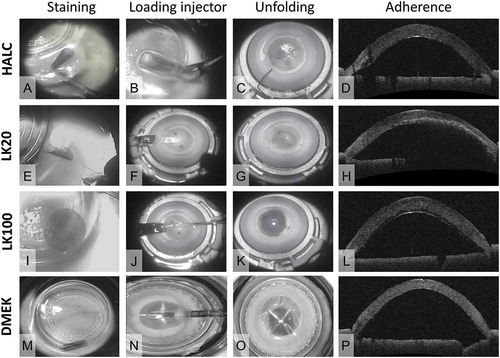
Table 1. In vitro surgeries with pCEC-carrier constructs: scoring scheme. Each parameter under evaluation was rated on a 5-point scale (i.e. 0–5) by two DMEK surgeons, with higher score indicating greater similarity to in vivo DMEK behaviour. A DMEK-graft was tested as a positive control and served as a reference point for the scoring. Values are reported as means.
Figure 5. In vitro surgeries with pCEC-carrier constructs. The upper three rows show each of the three tested pCEC-carriers constructs after staining with hypotonic Trypan Blue solution 0.04% (A,E,I), insertion into the artificial chamber (B,F,J), unfolding (C,G,K), and adherence to the bare stroma visualized by anterior segment OCT measurement (D,H,L). The lower row (M–P) shows the corresponding images of a DMEK-graft that served as a positive control and reference point for the scoring.