Figures & data
Figure 1. Size and in vitro release profile of VEGF-A165-loaded microparticles.
(a) Size distribution of VEGF-A165-loaded microparticles analyzed by DLS. (b) SEM image of VEGF-loaded microparticles. DLS represents dynamic light scattering. The diameter of the VEGF-loaded microparticles was ~4.2 µm. 1000 nm = 1 µm.
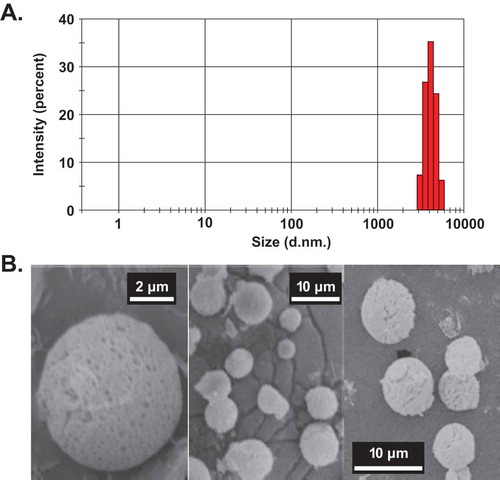
Figure 2. Representative FA images at the phases of retinal vascular development.
RVD represents Retinal Vascular Development. Summary of the major features of representative FA images in the Phases of RVD are shown: Early (P16-20), Mid (P23-27), Late (P30-34), and Mature (>P35).Citation25
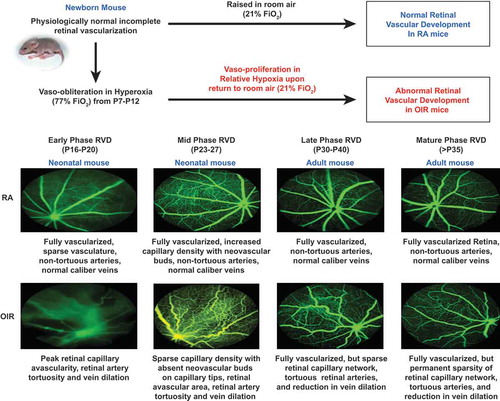
Figure 3. Method of assessment of retinal vascular features.
(a) Fluorescein angiogram (FA) of OIR Mouse. (b) Retinal avascular area – calculated from the binary image generated from the FA image as the area of black space as a percentage of total retinal image. (c) Retinal artery tortuousity (RAT) – calculated by selecting branch points along the most tortuous artery using a cursor, from the base of the optic nerve up to a validated distance of 275 ± 25 μm for OIR mice. A linear projection was automatically projected by the software program to connect the first and last points. RAT index is calculated as the ratio of actual vessel length to the projected linear length. RAT of 1 is a non-tortuous vessel, while an RAT index more than 1 denotes degree of arterial tortuosity. (d) Retinal vein width (RVW) – calculated using semi-automated calibrations between two points aligned horizontally at either edge of the largest vein in the FA image starting from the optic nerve base to a pre-validated distance of 275 ± 25 μm. The customized MATLAB program is available at www.quantbv.com.
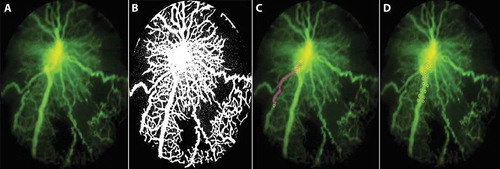
Figure 4. Quantification of in vivo fluorescein angiography in VEGF-loaded and empty microparticles.
Quantification of retinal vascular parameters. A shows FA images, B shows decreased retinal avascular area, C shows reduced vein dilation, and D shows reduced arterial tortuosity.Note: RAA: retinal avascular area (%); RVW: retinal vein width (µm); RAT: retinal artery tortuosity index. All values are presented as mean ± SD.Empty represents empty microparticle injection; VEGF represents VEGF-loaded microparticle injection; RE: right eye; LE: left eye. NS denotes not statistically significant. *p < 0.05 **p < 0.01, ***p < 0.001.
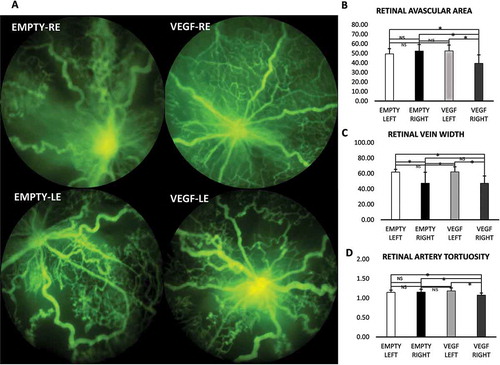
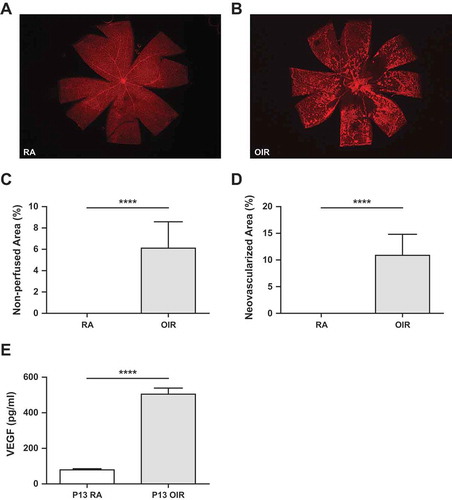
Figure 5. Retinal flatmount and quantification of retinal VEGF levels by ELISA.
Assessment of retinal vaso-obliteration, neovascularization, and VEGF levels during OIR. A. Retinal flatmount of a room air mouse. B. Retinal flat mount showing vaso-oblietration and neovascularization. C. Quantification of Vaso-obliteration or non-perfused retinal area relative to total retinal area. D. Quantification of retinal neovascularization relative to total retinal area. E. Graph shows values for VEGF ELISA at P13 in RA and OIR mice (****p < 0.0001).Note: RA: room air; OIR: oxygen-induced ischemic retinopathy.