Figures & data
Figure 1. Heat map representation of familial glaucoma associated genes based on expression data from the ocular tissue database. We ranked genes by expression level and assigned percentiles (P). Red: >90th P, yellow: 50th –90th P, green: 10th–50th P, blue: <10th P. Abbreviations: CB: Ciliary body; TM: Trabecular meshwork; ONH: Optic nerve head.
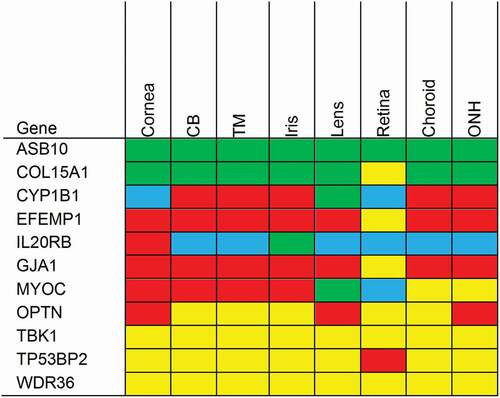
Figure 2. Heat map representation of highly likely POAG genes based on expression data from the ocular tissue database. We ranked genes by expression level and assigned percentiles (P). Red: >90th P, yellow: 50th–90th P, green: 10th–50th P, blue: <10th P. For SNPs situated in between genes, we listed the gene expression of both neighboring genes (these genes are highlighted in pairs in pink). Abbreviations: CB: Ciliary body; TM: Trabecular meshwork; ONH: Optic nerve head.
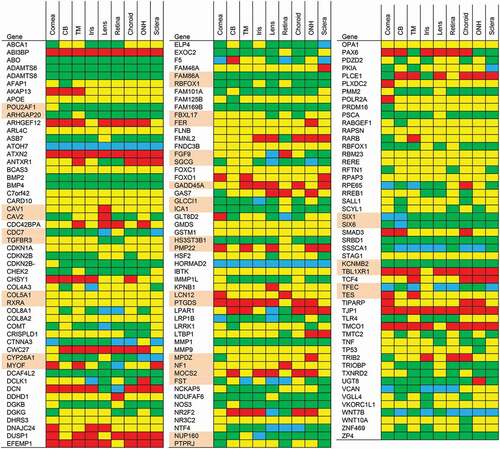
Figure 3. Heat map representation of less likely POAG genes based on expression data from the ocular tissue database. We ranked genes by expression level and assigned percentiles (P). Red: >90th P, yellow: 50th–90th P, green: 10th–50th P, blue: <10th P. For SNPs situated in between genes, we listed the gene expression of both neighboring genes (these genes are highlighted in pairs in pink). Abbreviations: CB: Ciliary body; TM: Trabecular meshwork; ONH: Optic nerve head.
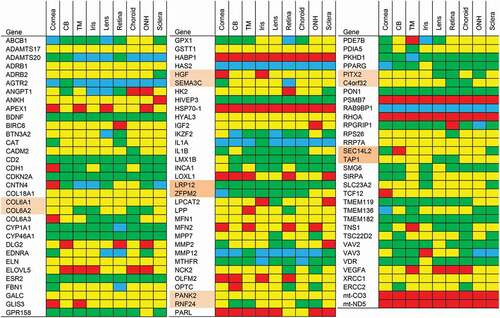
Figure 4. In situ hybridization staining (red dots) of Optn in cornea (a), ciliary body (b), trabecular meshwork with iridocorneal angle (c), optic nerve head (d), and retina (e). Sections are of pigmented (a, c, e) or albino mice (b, d). Scale bar: 50 µm for optic nerve, 25 µm for all other sections.
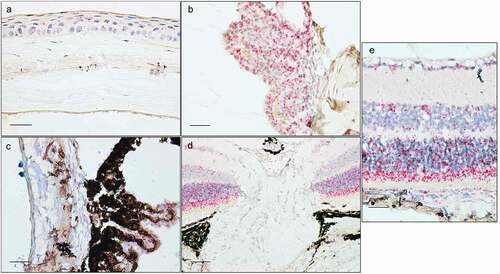
Figure 5. In situ hybridization staining (red dots) of Tnf (a), Tgfβr3 (b), F5 (c), and Dusp1 (d) transcripts in the central cornea. Scale bar: 25 µm.
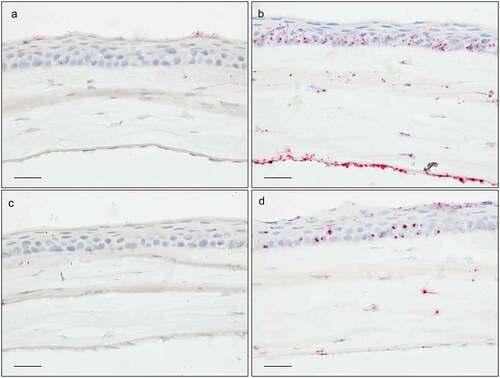
Figure 6. In situ hybridization staining (red dots) of Tnf (a), Tgfβr3 (b), F5 (c), and Dusp1 (d) transcripts in the ciliary body of albino mice. Scale bar: 25 µm.
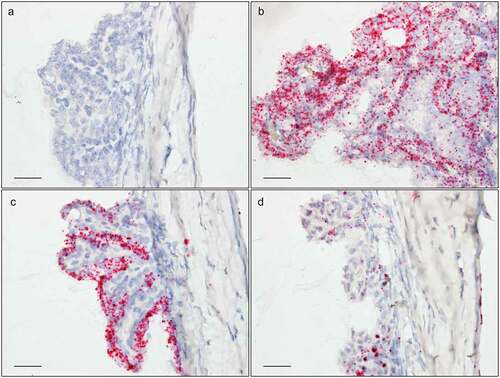
Figure 7. In situ hybridization staining (red dots) of Tnf (a), Tgfβr3 (b), F5 (c), and Dusp1 (d) transcripts in the trabecular meshwork and at the iridocorneal angle. Scale bar: 25 µm.
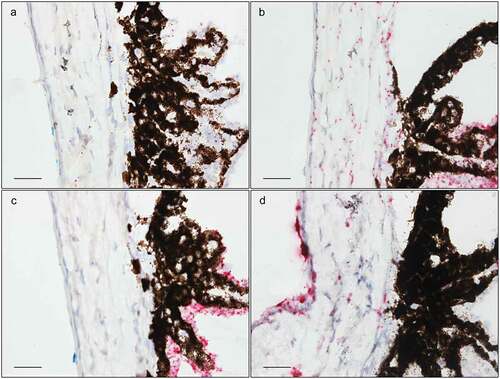
Figure 8. In situ hybridization staining (red dots) of Tnf (a), Tgfβr3 (b), F5 (c), and Dusp1 (d) transcripts in the retina of albino mice. Scale bar: 25 µm.
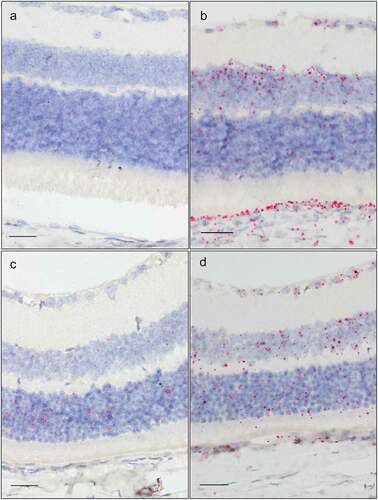
Figure 9. In situ hybridization staining (red dots) of Tnf (a), Tgfβr3 (b), F5 (c), and Dusp1 (d) transcripts in the optic nerve head region of the retina. Scale bar: 50 µm.
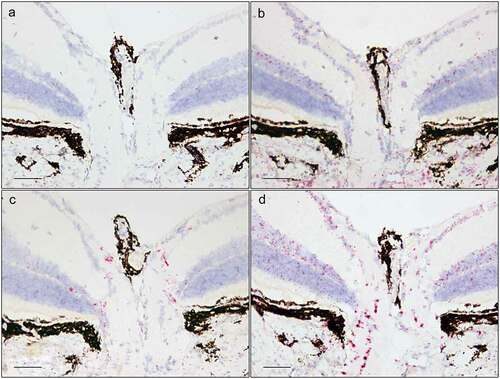
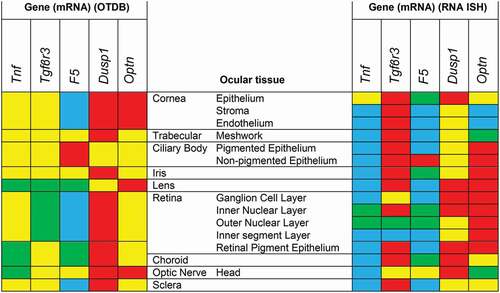
Figure 10. mRNA expression heat maps based on the ocular tissue database (OTDB) microarray data on the left and RNA in situ hybridization (RNA-ISH) expression on the right. Microarray gene expression was classified in percentiles and RNA-ISH data in semiquantitative categories. Blue is <10th percentile; respectively no expression, green is between 10th and 50th percentile; low expression, yellow is between 50th and 90th percentile; moderate expression, red is >90th percentile; high expression.