
Figures & data
Figure 1. Design of the Aspira-aXA intracoular lens
Figure 2. (a) Example of rotational stability evaluation performed with Photoshop. The reference axis is drawn by joining two critical details (e.g. Axenfeld-loops, limbal vessels) and the comparison axis is drawn by joining the IOL toric markings. (b) Example of tilt and decentration evaluation with customized Matlab code demonstrated with a raw image of Pentacam. For study data, a geometric distortion correction of the image was applied before data analysis
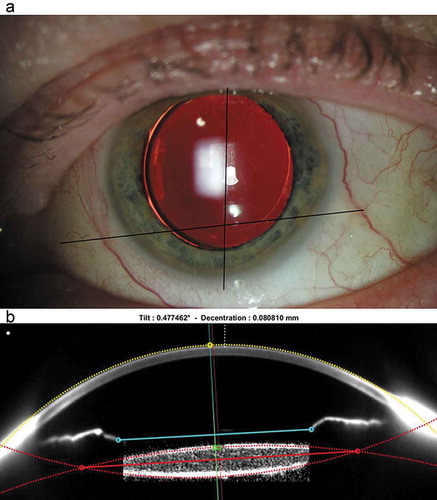
Table 1. Preoperative patient demographics; values are expressed as mean ± SD and median (range)
Table 2. IOL rotation at different follow-up stages to the entire study population
Figure 3. IOL rotational stability boxplot for all eyes from end of surgery (EoS) to each follow-up and in between follow-ups
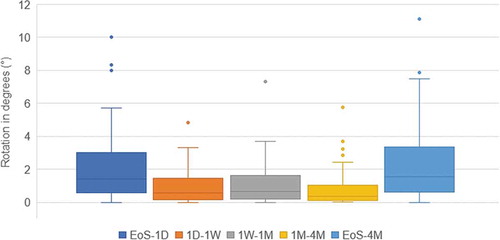
Table 3. Mean (± SD) absolute tilt and decentration values for the right eyes (n = 24) and left eyes (n = 21)
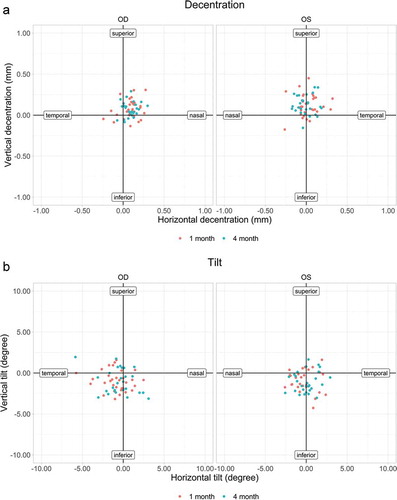
Figure 4. (a) Decentration (mm) of all IOLs within the right (OD) and left (OS) eyes. (b) Tilt (degrees) of all IOLs within the right (OD) and left (OS) eyes
Data availability
The data used to support the findings of this study are available from the corresponding author upon request.