Figures & data
Figure 1. Schematic sketch of the experimental setup for Pe-Ha-Blue®PLUS and Vision Blue®
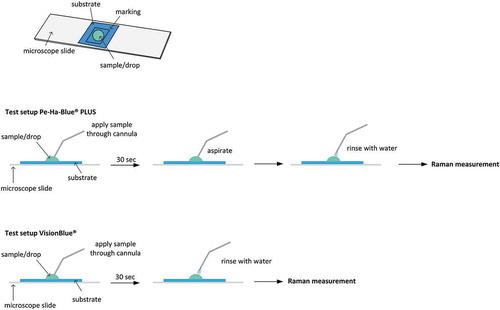
Figure 2. Light microscopy images of the reference samples for Pe-Ha-Blue®PLUS (top left) and Vision Blue® (top right) with marked mapping area of the Raman measurement (blue line). The false-color plots show the distribution of TB as an integral over the Raman band 1547–1589 cm−1 for the Pe-Ha-Blue®PLUS reference sample (bottom left) and the Vision Blue® reference sample (bottom right)
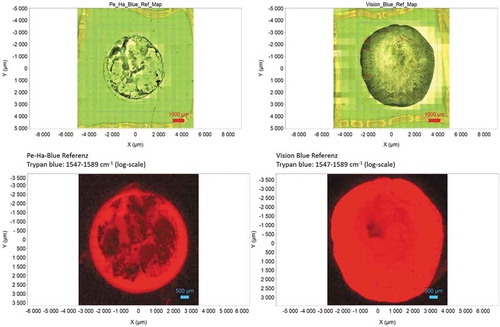
Figure 3. The light microscopic images of the test samples of Pe-Ha-Blue®PLUS (top left) and Vision Blue (bottom right) show no visible TB residues within the mapping area marked (blue line). The false color display does not show any TB residues for Pe-Ha-Blue®PLUS (left bottom), the Vision Blue test sample (right bottom) shows a light, drop-like area from the darker edge area
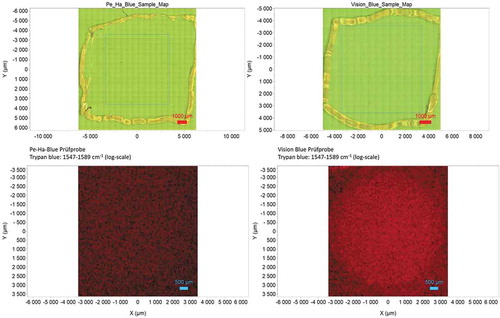
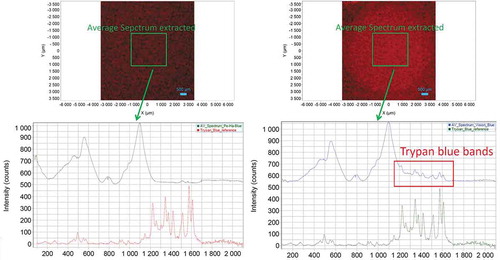
Figure 4. Extracted average spectrum over an area of 2 × 2 mm from the test samples of Pe-Ha-Blue®PLUS (top left) and Vision Blue® (top right). The mean spectrum of the Pe-Ha-Blue®PLUS test specimen (lower left) does not show any specific TB Raman bands; in the Vision Blue® test specimen the Raman bands are clearly visible in the TB-relevant range between 1200 and 1600 cm−1 (lower right)