
Figures & data
Figure 1. Neurite outgrowth in retinal explants incubated with selected growth factors. Retinal explants were incubated with increasing concentrations of recombinant human neuregulin 1 β1 (NRG1; 10, 50 and 100 ng/ml), recombinant human connective tissue growth factor (CTGF; 10, 50 and 100 ng/ml) and recombinant human platelet-derived growth factor (PDGF; 1, 10 and 50 ng/ml). A combination of recombinant brain-derived neurotrophic factor (BDNF) and ciliary neurotrophic factor (CNTF) was used as positive control (B/C), and untreated explants served as a negative control (CON). (a) Total neurite outgrowth area was determined by automated morphometric analysis of β-tubulin immunostained mouse retinal explants. Results are presented as mean ± SEM of 8–13 explants of 2 biological repeats. One-way ANOVA with Dunnett’s multiple comparison test was used to calculate statistical differences (** P < .01, *** P < .001). (b) Representative images of explants of each condition are shown with NRG1, CTGF and PDGF-BB at a concentration of 50 ng/ml. Scale bar is 500 µm
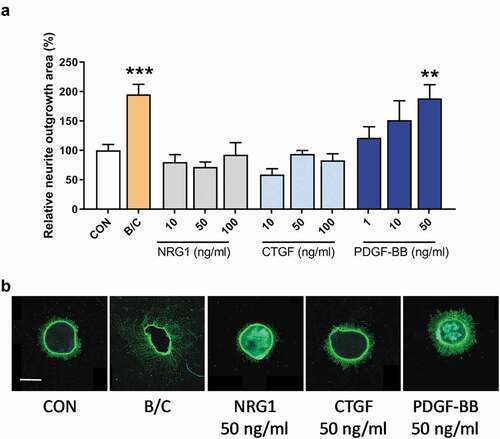
Figure 2. Neurite outgrowth in retinal explants incubated with three different PDGF dimers. Retinal explants were incubated with increasing concentrations (10, 50 and 100 ng/ml) of PDGF-AA, -AB or -BB. A combination of recombinant brain-derived neurotrophic factor (BDNF) and recombinant ciliary neurotrophic factor (CNTF) was used as positive control (B/C). Relative neurite outgrowth area was determined as compared to control conditions (CON) in total (a) and 100 µm segments of 0–100 µm (b), 100–200 µm (c), 200–300 µm (d) and >300 µm segments (e). Results are presented as mean ± SEM of 14–36 explants of three biological repeats. One-way ANOVA with Dunnett’s multiple comparison test was used to calculate statistical differences (* P < .05, ** P < .01, *** P < .001, **** P < .0001). (f) Representative images of explants of each condition are shown with each PDGF-dimer at a concentration of 50 and 100 ng/ml. Scale bar is 500 µm
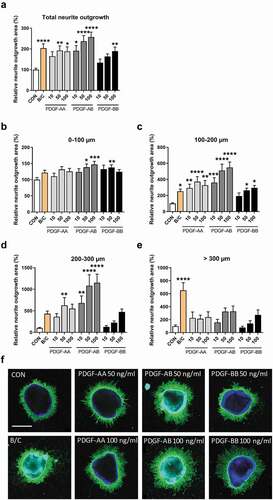
Figure 3. Neurite outgrowth in retinal explants incubated with vitreous of PDR patients or non-diabetic controls with macular holes in the presence or absence of the PDGFR inhibitor CP673451. (a) CP673451 blocks downstream signaling of both PDGFRα and -β leading to processes such as proliferation, differentiation and migration. Relative neurite outgrowth area was determined as compared to control conditions (CON) in total (b), 100 µm segments of 0–100 µm (c) and 100–200 µm (d). Results are presented as mean ± SEM of 6–10 explants of two biological repeats. Unpaired t-tests were used to calculate statistical differences (* P < .05, ** P < .01). (e) Representative images of explants cultured with pooled control vitreous or pooled vitreous of PDR patients in the presence or absence of CP673451 (CP). Scale bar is 500 µm
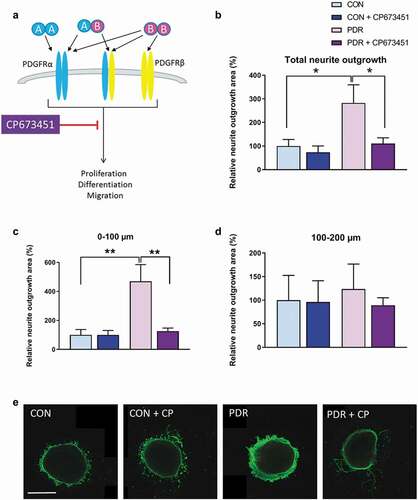
Figure 4. Expression of PDGFRA and PDGFRB in vitreoretinal membranes and human retina. Levels of PDGFRA and PDGFRB mRNA was determined by real-time quantitative PCR and presented as absolute amounts in Log10 scale. Mean ± SD are given of fibrovascular membranes of patients with PDR (PDR, n = 4), idiopathic epiretinal membranes of non-diabetic patients with a macular pucker (iERM, n = 5) and non-diabetic retina (Retina, n = 6). All data points of PDGFRA and one data point of PDGFRB in retina was below 1 and therefore not visible in the graph. The Mann–Whitney U test was used to compare statistical differences between groups (**P < .01)
Data availability statement
Raw data were generated at the Department of Biology, KU Leuven, and the Department of Ophthalmology, Amsterdam UMC. Derived data supporting the findings of this study are available from the corresponding author [I.K.] on request.