Figures & data
Table 1. Data of refraction and ocular biometrics in the two groups (mean ± SEM)
Figure 1. Interocular differences in RE (a), VCD (b), and AL (c) Before and after form-deprivation treatment in the saline and the atropine groups (mean ± SEM, experimental – fellow). The myopic progression in FDM eyes was significantly retarded in the atropine group. Interocular differences after the treatment were plotted, showing a significant linear correlation between RE and VCD (d), and between RE and AL (e). (a–c) Two-way mixed ANOVA with a Bonferroni post hoc test: **: P < .01; ***: P < .001; ****: P < .0001; D -E: linear regression analysis, n = 10. RE: refractive error, VCD: vitreous chamber depth, AL: axial length
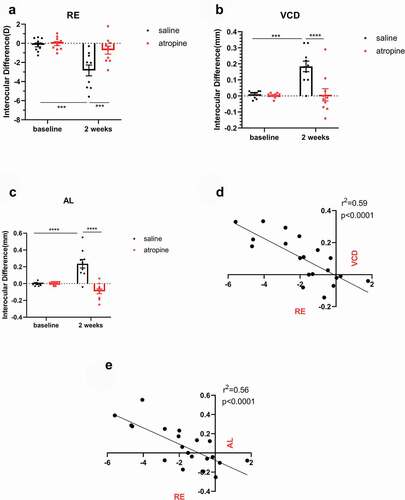
Table 2. Data of retinal and choroidal thickness in the two groups (mean ± SEM)
Figure 2. Interocular differences in retinal thickness (a) Outer retinal thickness, ORT, (b) Inner retinal thickness, IRT (c), and choroidal thickness, ChT (d) before and after treatment in the saline and atropine groups (mean ± SEM, experimental – fellow). The retinal thickness (a) and the outer retinal thickness (b) were increased with the treatment of atropine, while they were unaffected in the saline group. The inner retinal thickness showed no difference between the two groups (c). There was a decreasing trend for ChT in the saline-treated FDM eyes, yet the trend was diminished by atropine treatment (d). Two-way mixed ANOVA with a Bonferroni post hoc test: **: P < .01; ***: P < .001, n = 7
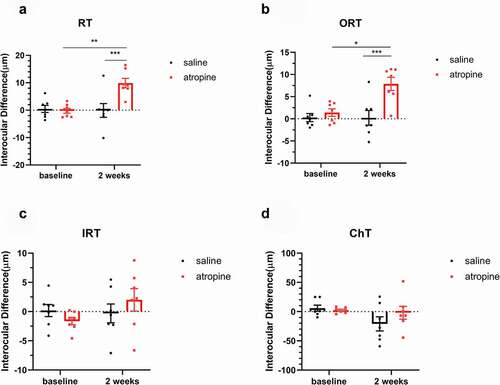
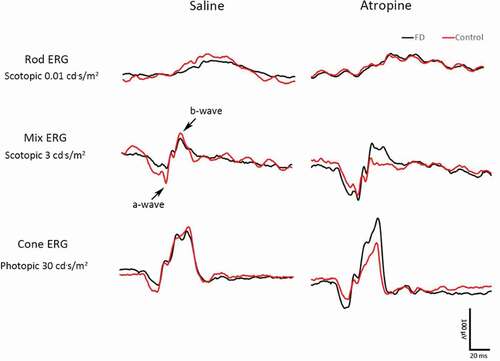
Figure 3. ERG wave of a representative guinea pig from the saline group (left) and the atropine group (right). The black curve indicates the FDM eye, while the red curve indicates the control eye
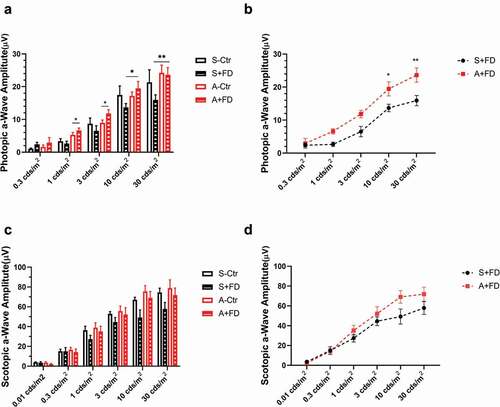
Figure 4. a-Wave amplitudes in the photopic (a), scotopic (c) adapted ERG. The comparison of the FDM eyes between two groups in the photopic (b), scotopic (d) adapted ERG (mean ± SEM). In the photopic ERG (a), the saline-treated FDM eyes show a declining trend in a-wave amplitudes compared to the control eyes. The differences were not statistically significant. The amplitudes in the atropine-treated FDM eyes were higher than the control eyes under the stimulation of 1 and 3 cd·s/m2 (A, paired t-test). The a-wave amplitudes increased significantly in the atropine-treated FDM eyes compared to the saline group under the stimulation of 10 and 30 cd·s/m2 (a and b, two-way repeated measures ANOVA with Bonferroni post hoc test). In the scotopic ERG, the a-wave amplitudes of atropine-treated FDM eyes tended to be higher than those of the saline-treated FDM eyes under higher stimulus intensity, but the differences were not significant (c,d): *: P < .05, **: P < .01, n = 8