
Figures & data
Table 1. Demographic and clinical characteristics of cataract patients and normal controls.
Table 2. Antibody.
Figure 1. FUNDC1 was high expression in cataract specimens. (A–C) Screening of DEGs associated with contract from GSE153933. (D) The mRNA expression of FUNDC1 in cataract was analyzed by bioinformatics from GSE153633. (E and F) The expression of FUNDC1 in cataract was measured by RT-qPCR (E) and western blotting (F). (G and H) SRA01/04(HLE) cells were treated with or without H2O2 treatment for 24 h, and then the expression of FUNDC1 was determined by RT-qPCR (G) and western blotting (H). Error bars represent data from three independent experiments (mean ± SD). *p<.05, **p<.01, ***p<.001.
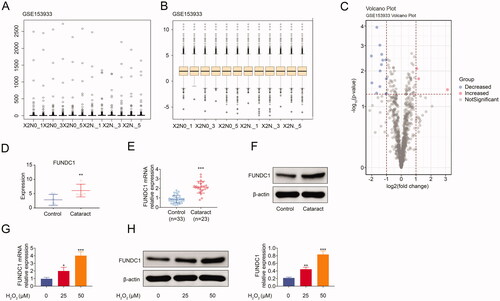
Figure 2. Hypomethylation of FUNDC1 in SRA01/04 cells under oxidative stress. (A) FUNDC1 promotor CpG island was predicted by MethPrimer online software. (B) MSP assay analyzed the methylation expression of FUNDC1 between cataract groups and control group. (C) SRA01/04(HLE) cells were treated with or without H2O2 treatment for 24 h, and then the methylation expression of FUNDC1 was determined by MSP. (D) The expression of DNA methyltransferases was measured by western blotting. Error bars represent data from three independent experiments (mean ± SD). ***p<.001.
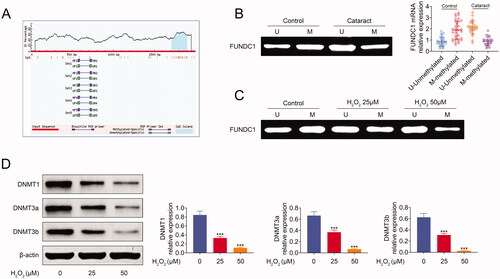
Figure 3. FUNDC1 promoted SRA01/04 cell apoptosis under oxidative stress. (A) SRA01/04(HLE) cells were transfected with the indicated plasmids, treating with 50 uM H2O2 for 24 h, and then the expression of FUNDC1 was measured by western blotting. (B and C) SRA01/04(HLE) cells were treated as in (A), and cell apoptosis was determined by flow cytometry (B) and quantified (C). (D) Collecting the same cells as in (B), western blotting analyzed the expression of apoptosis-related proteins. Error bars represent data from three independent experiments (mean ± SD). *Compared to a control group, #compared with the si-NC group, @compared to the vector empty group. *p<.01, ***p<.001, #p<.05, ###p<.001, @p<.05, @@p<.01, @@@p<.001.
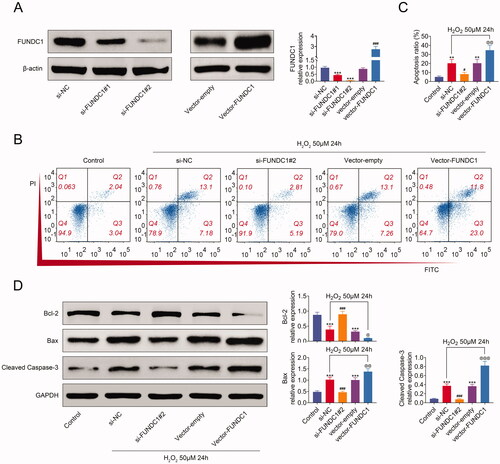
Figure 4. FUNDC1 increased autophagy in SRA01/04 cells under oxidative stress. (A) SRA01/04(HLE) cells were transfected with the indicated plasmids, treating with 50 uM H2O2 for 24 h, and then the expression of autophagy-related proteins was measured by western blotting. Error bars represent data from three independent experiments (mean ± SD). *p<.01, ***p<.001, #p<.05, ###p<.001, @p<.05. (B) Immunofluorescence assay analyzed the LC3 expression in different treatment SRA01/04(HLE) cell lines.
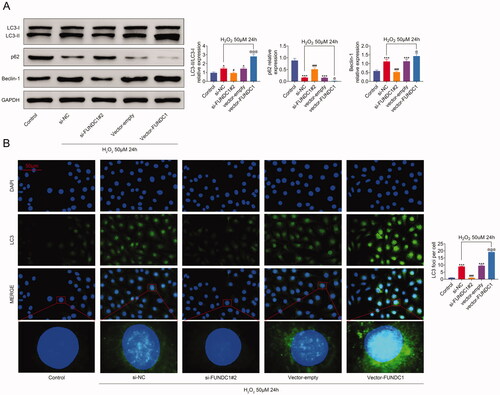
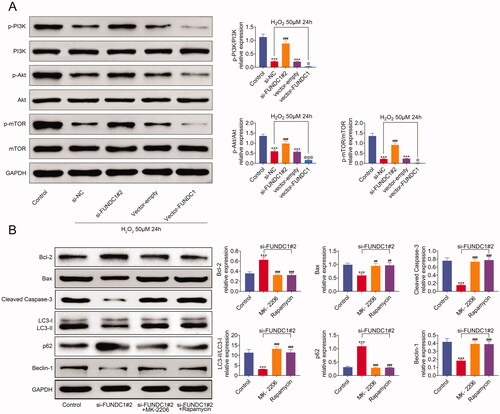
Figure 5. FUNDC1 inhibited PI3K/Akt/mTOR pathway activity under oxidative stress. (A and B) Western blotting assay analyzed the expression of PI3K/Akt/mTOR signaling pathway, apoptosis, and autophagy-related proteins. Results presented represent the means of triplicate experiments ± SEM. ***p<.001, ###p<.001, @p<.05.
Data availability statement
Data sharing is not applicable to this article as no new data were created or analyzed in this study.