Figures & data
Figure 1. Effect of miR-34a-5p, miR-630 and miR-335-5p transfection on the viability of HLE-B3 cells. (A–C) The expression levels of miR-34a-5p, miR-630 and miR-335-5p expression were detected by qRT-PCR in the HLE-B3 cell after transfection with miR-34a-5p, miR-630 and miR-335-5p mimics and inhibitor, respectively. (C–F) CCK-8 assay was applied to observe the effect of miR-34a-5p, miR-630 and miR-335-5p mimics/inhibitor transfection on cell viability. *p < 0.05; **p < 0.01; ***p < 0.001.
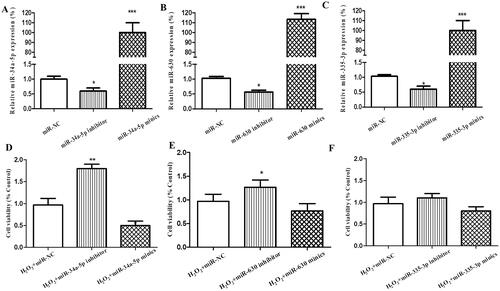
Figure 2. Effect of miR-34a-5p on apoptosis and ROS level of HLE-B3 cells. (A) Apoptosis of HLE-B3 cells transfected with miR-34-5p mimics and inhibitor after H2O2 exposure were determined by flow cytometry. (B) DCFH-DA assay was used to detect the ROS level of HLE-B3 cells transfected with miR-34-5p mimics and inhibitor. *p < 0.05; **p < 0.01.
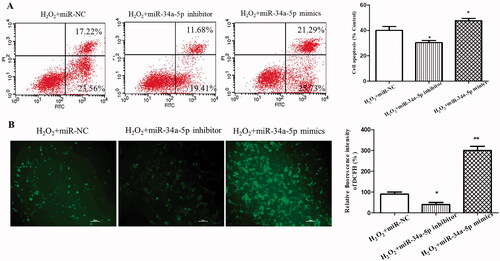
Figure 3. Combined analysis of proteomics and bioinformatics for screening target genes of miR-34a-5p. (A) Flow chart of proteomic analysis. (B) Total identified, quantified proteins and differentially expressed proteins. (C) Target gene selection by combining results of proteomic and bioinformatics analysis.
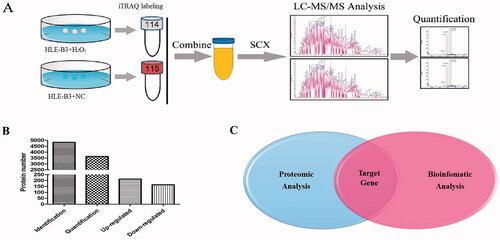
Figure 4. GPX3 is the downstream target of miR-34-5p. (A) qRT-PCR was applied to observe the expression of GPX3 in HLE-B3 cells transfected with miR-34-5p mimics and inhibitor. (B) Western blot was used to detect the expression of GPX3 in HLE-B3 cells transfected with miR-34-5p mimics and inhibitor. (C) The complementary binding site of GPX3 and miR-34-5p was predicted by TargetScan. (D) Luciferase reporter assay was performed to confirm the predicted binding of GPX3 and miR-34-5p. *p < 0.05.
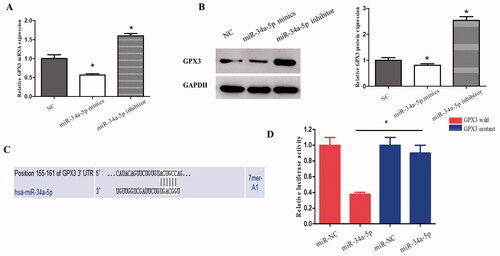
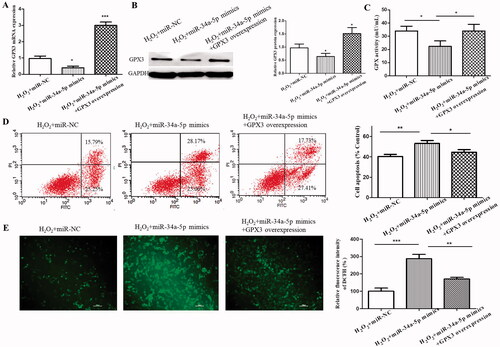
Figure 5. Further validation of miR-34-5p-GPX3 axis. (A) The mRNA level of GPX3 in H2O2-treated HLE-B3 cells which were transfected with miR-NC, miR-34a-5p mimics and miR-34a-5p mimics + GPX3 overexpression, respectively. (B) Western blot analysis determining the changes of GPX3 expression level in control, miR-34-5p with/without GPX3 overexpression. (C) GPX activity of the three transfection groups. (D) Percent cell apoptosis of HLE-B3 cells for the aforementioned groups. (E) The amount of cellular ROS in the above mentioned groups. *p < 0.05, **p < 0.01, ***p < 0.001.