
Figures & data
Figure 1. Time schedule of the experimental protocol. ●: Measurements of blood pressure, heart rate, intraocular pressure and laser speckle flowgraphy. ■: Measurement of plasma aldosterone concentrations. ◎: Fundus photography. ♦: Injection of Fast Blue into the superior colliculus. ▲: Retinal flatmount preparation for quantification of retinal ganglion cells.
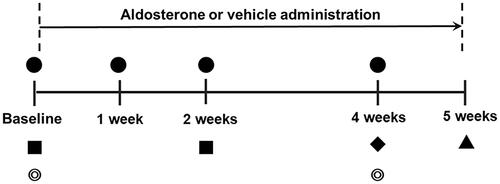
Figure 2. Representative images of rat fundus around the optic nerve head and measurements of retinal vessel diameters using LSFG-Micro. (A) Representative color-coded blood flow map produced by LSFG-Micro. The white circle shows a rubber band – the region of interest to measure MBR by LSFG in the optic nerve head. (B) Binary image for automated segmentation between the visible vessel area (white) and tissue area (black), using LSFG analysis software. (C) Representative fundus photographs of a normal rat used in this study. (D) Total retinal artery and vein analysis in the same rat retina as (C). The rectangular areas were set semiautomatically to the vessels. (E,F) show the vessel diameter index in rectangles 1 and 2, respectively. A: Artery; LSFG: laser speckle flowgraphy; MBR: mean blur rate; V: Vein.
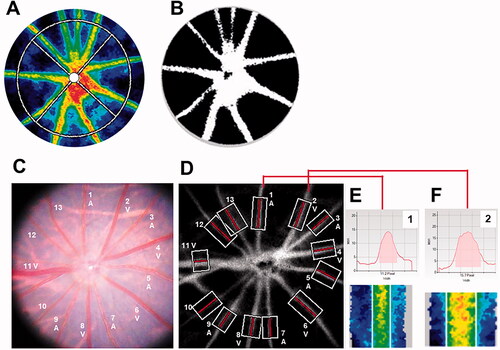
Figure 3. Representative color-coded maps of optic nerve head blood flow by LSFG-Micro and fundus photos in systemic aldosterone-treated rats. Blood flow image in the optic nerve head obtained before administration (baseline, A) and 1 (B), 2 (C), and 4 (D) weeks after administration of aldosterone. The color scale is shown at the bottom right. Fundus photographs taken before (E) and 4 weeks after (F) systemic administration of aldosterone in the same eye as (A–D). LSFG: laser speckle flowgraphy.
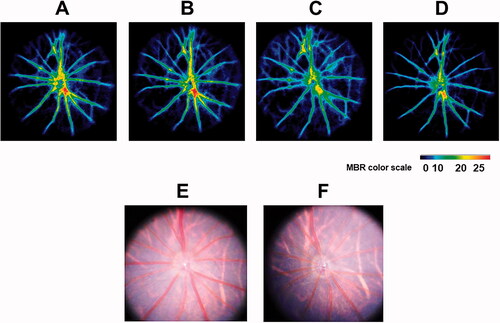
Figure 4. Changes in the MBR in the optic nerve head and retinal vessel diameter from baseline after systemic administration of aldosterone or vehicle for 4 weeks. Changes in the MV (A) and MT (B) are shown (aldosterone group, n = 13; vehicle, n = 9). Changes in the diameter of arteries (C) and veins (D) are shown (aldosterone group, n = 13; 48 arteries, 49 veins. vehicle, n = 9; 41 arteries, 43 veins). Error bars denote 95% confidence interval (A, B, C, D). Significant changes are indicated (*p < 0.05, †p < 0.01, ‡p < 0.001; Bonferroni correction for multiple comparisons). MBR: mean blur rate; MV: mean blur rate in the vessel; MT: mean blur rate in the tissue.
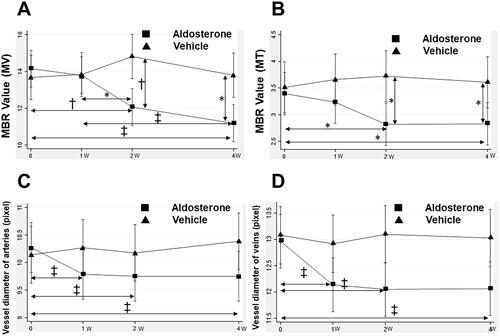
Figure 5. Change in IOP, mean arterial pressure, heart rate, and OPP after systemic administration of aldosterone or vehicle for 4 weeks. Changes in IOP (A), mean arterial pressure (B), heart rate (C), and OPP (D) are shown. Error bars denote the 95% confidence intervals (aldosterone group, n = 13; vehicle, n = 9). IOP: intraocular pressure; OPP: ocular perfusion pressure.
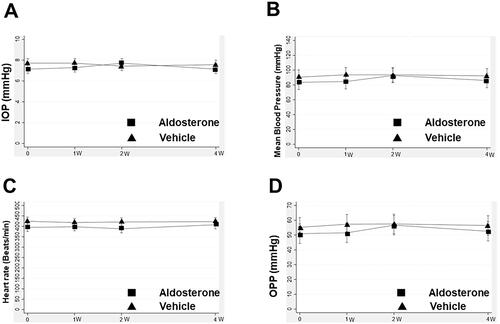
Figure 6. RGC loss and plasma aldosterone level after systemic administration of aldosterone. Retrogradely labeled RGCs in the aldosterone group (A) and vehicle (B). (C) RGC density in retinal flatmounts prepared 5 weeks after systemic administration of aldosterone or vehicle (aldosterone group, n = 9; vehicle, n = 7). (D) Plasma aldosterone concentration before and 2 weeks after systemic administration of aldosterone (n = 7). Data are presented as the mean ± standard deviation. Paired t-test. †p < 0.01, ‡p < 0.001. RGC: retinal ganglion cell.
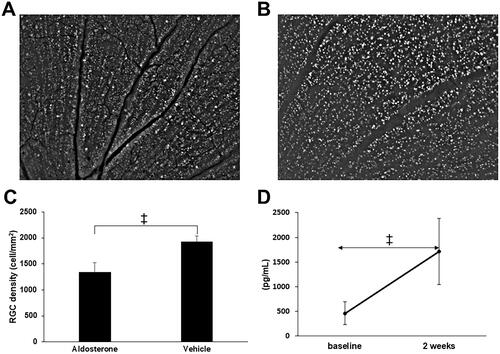
Table 1. Association of increase in plasma aldosterone with changes in various measurements.
Data availability statement
The data that support the findings of this study are available from the corresponding author [T.H.], upon reasonable request.