Figures & data
Figure 1. The number of fluorescent emitted photons from the tear film equals the product of the number of absorbed photons and the fluorescent efficiency. Blue arrows give incident photons, green circles and arrows represent absorption and emission by fluorescein molecules and black circles give absorption with quenched (no) fluorescence. Of the 60 incident photons, 12 (20%) are absorbed, of which half emit photons corresponding to an emission of 6 (10% of incident) photons. (It may be noted that many emitted photons pass backwards into the eye, or are internally reflected by the tear surface, so only a small fraction pass out into the air and can be observed – part of the reason fluorescence is so weak compared to the incident illumination.).
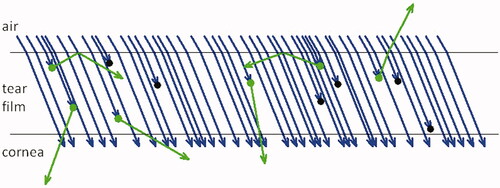
Figure 2. Effect of divergent flow and local evaporation (yellow arrows) on reduced fluorescent intensity and breakup at low and high fluorescein concentrations. The yellow arrows indicate where water goes: for evaporation, water leaves the tear film into air above, and for divergent flow, the water stays in the tear film but flows away from the center of the sketch. Black arrows and text indicate changes in each central factor relative to the surrounding tear film. In each of the four panels, green spots in the upper plot represent fluorescence of fluorescein molecules, the size of the spot indicating fluorescent efficiency, which is reduced by self-quenching at high fluorescein concentrations. The bottom image in each panel gives the expected intensity distribution from EquationEquation 2(2)
(2) . (A) Reduced fluorescence due to divergent flow can be visualized under conditions of low fluorescein concentration (much less than the critical concentration in the tear film), while (B) the increased fluorescein concentration is not sufficient to cause self-quenching and hence to visualize local evaporation. Under conditions of high fluorescein concentration (greater than the critical concentration in the tear film), both (C) divergent flow and (D) local evaporation result in reduced fluorescent intensity.
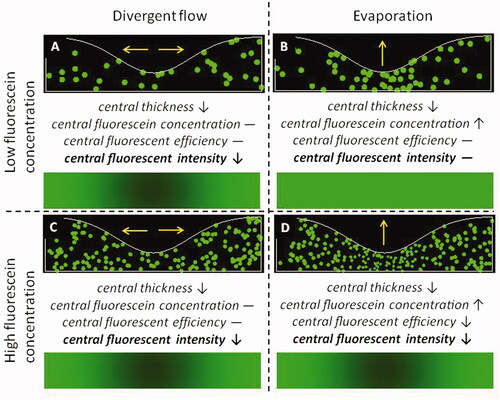
Figure 3. Fluorescein images for two subjects – Panel A is for one subject, whereas Panels B and C are for a second subject. “low” indicates fluorescein tear film concentration was much less than the critical concentration (instillation of 1 µL of 0.1% fluorescein), whereas “high” indicates tear film concentration was greater than the critical concentration (instillation of 1 µL of 5% fluorescein). (In the low concentration images, bright areas are seen from lens fluorescence and reflections from the two light sources.) Time after a preceding blink is also given. For Subject 1, dark spots are seen with low fluorescein concentration indicating that local reduction of fluorescent intensity is due to divergent flow, cf. ; as expected from , similar reduced fluorescence was observed for high concentration, results not shown. For Subject 2, pronounced dimming is seen for high but not low concentration, indicating the effect of evaporation, see . Images obtained with imaging system of King-Smith et al.Citation24
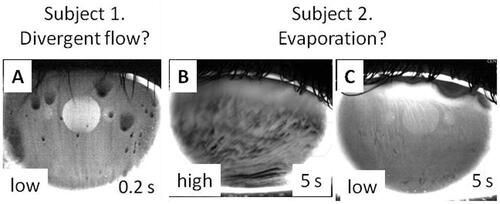
Figure 4. Classification of possible mechanisms of tear film thinning, either before or after touchdown. The evaporation branch is a primary driver of tear film thinning, represented as the only mechanism on the left side of the tree. On the right side of the tree, there may be different types of divergent flow as discussed in the text.
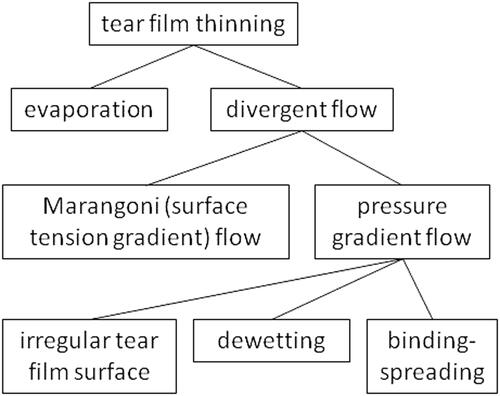
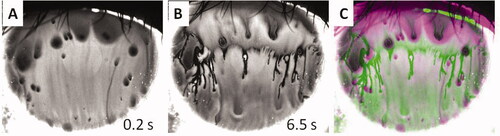
Figure 5. Changes in tear film breakup pattern. A. 0.2 s after a blink. B. 6.5 s after the blink. C. Pseudocolor image combining first image. A, in green with second image, B, in magenta. Images obtained after instillation of 1 µL of 0.5% fluorescein. B and C show remarkable changes in the TBU pattern long after the rapid TBU imaged in A.