
Figures & data
Figure 1. Representative images of male and female whole mount chicken corneal stromal nerves from 6-month-old chickens. The whole cornea was labeled with anti-PGP9.5 antibody, and images were recorded using a fluorescent microscope with a 10× objective lens focusing on the middle stroma. Each reconstructed cornea consisted of about 150 images.
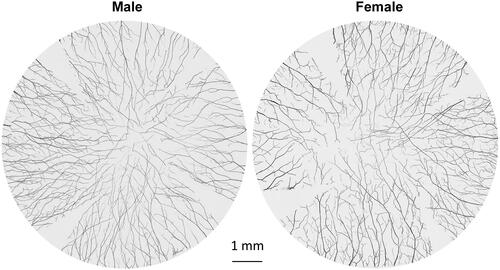
Figure 2. Epithelial nerve architecture of chicken cornea. (A) Two quadrants of corneal subbasal nerves were documented from a male and a female chicken of the same age (see Supplementary Figures 1 and 2 for entire images). (B) Highlighted images (10× lens) showing the detailed nerve structures at the corneal central (i, iii) and peripheral (ii, iv) zones. The images of the superficial terminals and the subbasal bundles were documented at the same points. (C) Cross-sectional view of chicken corneal nerve structure. Highlighted images show the detailed epithelial nerve distribution at the center and periphery. The image counterstained with DAPI shows the location of subbasal bundles (yellow arrows) and the shape of epithelial terminals (red arrows) in the central cornea.
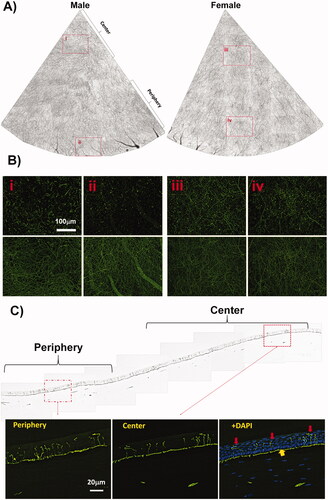
Figure 3. Relative content of SP and CGRP sensory neuropeptides in chicken corneas. (A, B) Representative images showing the expression of SP- and CGRP-positive nerves in the central subbasal nerve bundles, terminals, and limbal stromal trunks. Cross-sections double-labeled with PGP + SP or CGRP and counterstained with DAPI showing the detailed nerve structure in a transverse view. (C) Percentage of positive SP or CGRP subbasal nerves with respect to total nerve area (PGP9.5 nerves) in each image recorded with a 20× objective lens. Sixty images for each neuropeptide and the same number of images for PGP9.5 were recorded from four corneas. Data expressed as average ± SD. *P< 0.001.
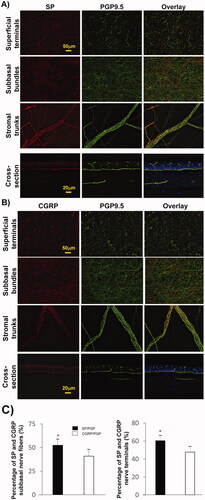
Figure 4. Effect of aging on chicken corneal epithelial nerve density. (A) Subbasal nerve density of chicken central corneas was calculated as the percentage of the total area in each image. The number of terminals was counted per mm2. Data expressed as average ± SD. *P< 0.05. (B) Representative images recorded with a 10× objective lens show the central epithelial nerve distribution in the cornea of young (6 months) and old (4 years) hens (see Supplementary Figure 3 for entire images).

Supplemental Material
Download Zip (101.5 MB)Data availability statement
The authors confirm that the data supporting the findings of this study are available within the article and its supplementary materials.