
Figures & data
Figure 1. Proliferation of UM cells exposed to hypoxic conditions for 72 h. UM cells were cultured in normoxic or hypoxic conditions for 72 h prior to harvesting and plating in 96 well plates. Subsequent changes in cell number in normoxic conditions was measured over 96 h. The graphs show data from a representative experiment n = 5 technical repeats (mean ± SEM). (A) MP41, (B) MP46, (C) 92.1, (D) OMM1. The table details the percentage reduction in cell number between hypoxic and normoxic conditions at 96 h (n = 3 biological repeats). Significant differences were determined by t-test.
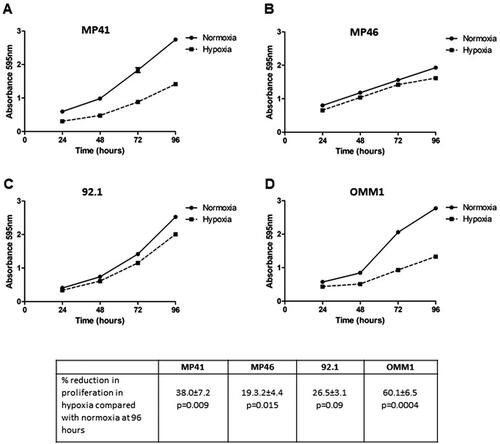
Figure 2. Clonogenicity of UM cells exposed to hypoxic conditions for 72 h. UM cells were cultured in normoxic or hypoxic conditions for 72 h prior to harvesting and plating in six well plates. Subsequent clonogenicity in normoxic conditions was measured. The graphs show data from a representative biological repeat (mean ± SEM, n = 6). (A) MP41, (B) MP46, (C) 92.1, and (D) OMM1. Significant differences were determined by t-test; ns: not significant, *p < .05, **p < .005, ***p < .0005.
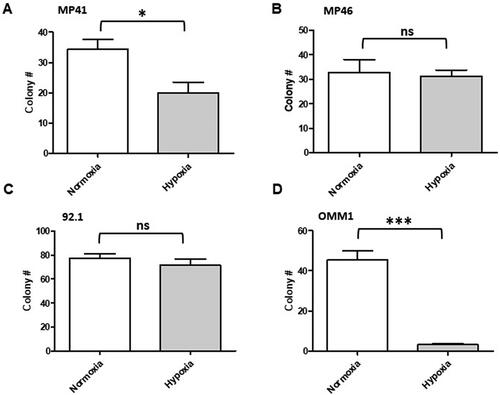
Table 1. Nodule-forming efficiency and nodule size following the transplantation of hypoxic or normoxic pre-conditioned UM cells onto the CAM.
Figure 3. Representative images of UM xenografts on the chick CAM harvested at E14. 92.1 (A and B) and MP41 (C and D) cells were cultured in normoxia (A and C) and hypoxia (B and D) for 72 h prior to harvesting and grafting onto the chick CAM. Nodules were removed and fixed in 10% NBF prior to histological and immunohistochemical examination. Top middle panels are H&E; bottom middle are Melan-A; top right are αSMA and bottom right are Ki67.
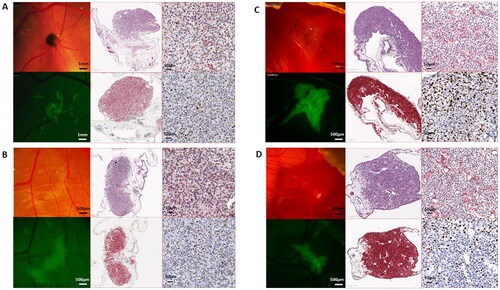
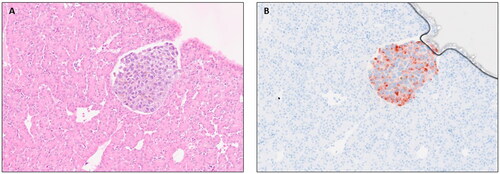
Figure 4. Metastatic lesion in the chick liver at E14 following engraftment of normoxic 92.1 cells onto the chick CAM. (A) H&E and (B) Melan-A stained UM cells.
Supplemental Material
Download JPEG Image (66.1 KB)
Data availability statement
The data supporting the findings of this study are available within the article and its supplementary materials.