
Figures & data
Table 1. Stress (kPa) at the strain of 6, 8, and 10%.
Figure 1. Young’s modulus at a strain of 10%. Group 1 = corneal crosslinking (CXL) with a fluence of 20 J/cm2, group 2 = CXL with a fluence of 15 J/cm2; group 3 = CXL with a fluence of 10.8 J/cm2; group 4 = CXL with a fluence of 5.4 J/cm2; group 5 = control group untreated corneas.
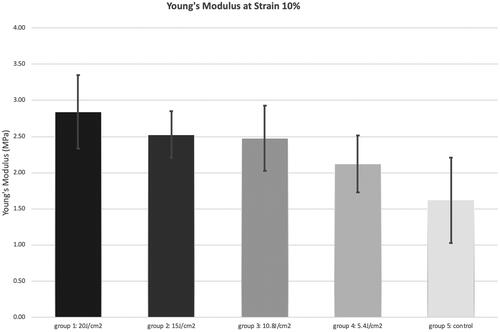
Table 2. p-Values resulting from post-hoc Bonferroni adjusted analysis of variance (ANOVA) between stress (kPa) at the strain of 10% after CXL with different fluences.
Data availability statement
The data that support the findings of this study are available from the corresponding author, [IF], upon reasonable request.