
Figures & data
Figure 1. Multimodal images from the left eye of a 38-year-old male patient with acute CSC. (A) FFA showed focal hyperfluorescence leakage points at macular (white arrow). (B) ICGA showed dilated choroidal vessels at the leakage area (white circle). (C) B-Scan OCT showed serous retinal detachment at macular with slight hyperreflective foci in the outer neuroretina (white arrow).
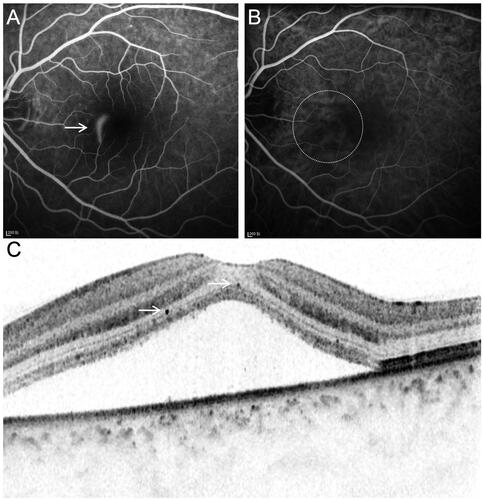
Figure 2. Multimodal images from the right eye of a 53-year-old male patient with chronic CSC. (A) FFA showed diffuse hyperfluorescence leakage points. (B) ICGA showed dilated choroidal vessels at the leakage area. (C) B-Scan OCT showed serous retinal detachment at macular with moderate hyperreflective foci.
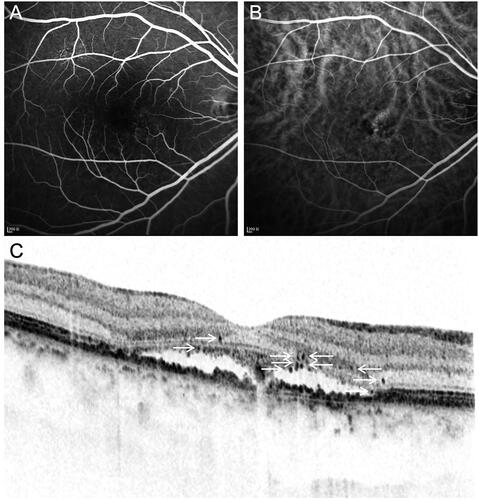
Table 1. Demographic data and clinical characteristics of patients with CSC and controls.
Table 2. OCT characteristics of patients with CSC and controls.
Figure 3. Box-and-whisker plot of vascular endothelial growth factor levels in the aqueous humor in the acute CSC, chronic CSC, and control groups.
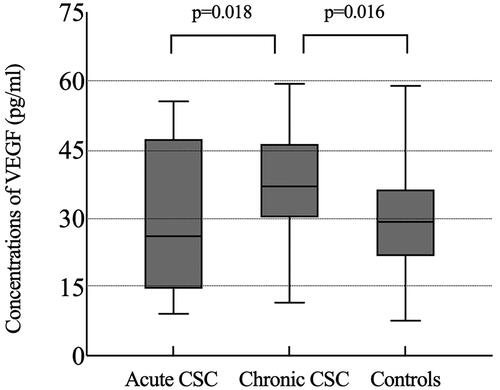
Table 3. Cytokines levels of patients with CSC and controls.
Table 4. Cytokines levels of CSC patients with slight or moderate number of HF.
Table 5. Correlation between the OCT characteristics and age, duration of the disease, or logMAR BCVA in the patients with CSC.
Table 6. Correlation between duration of the disease, logMAR BCVA, HF and six cytokine concentrations in the patients with CSC.
Data availability statement
The data used to support the findings of this study were supplied by Lijun Shen under license and so cannot be made freely available. Requests for access to these data should be made to Lijun Shen ([email protected]).