
Figures & data
Figure 1. Electroretinographic recordings on isolated retina. Isolated rat retina was continuously perfused with a nutrient solution and ERGs were recorded every 3 min. A Example of a single ERG recorded on isolated rat retina in response to white-light stimulation (0.025 lx.s scotopic, 1 ms). The a-wave amplitude was measured from the baseline to the trough of the a-wave, the b-wave amplitude was measured from the trough of the a-wave to the peak of the b-wave, and the amplitude of the slow PIII component was measured from the basal line to the trough of the slow PIII wave. B Example of a b-wave survival curve showing the evolution of the b-wave amplitude (µV) versus time (min) from a representative experiment.
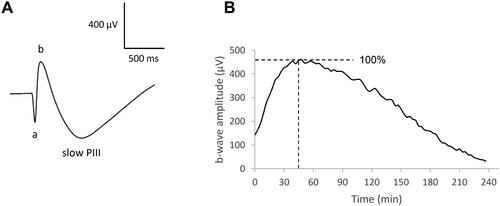
Figure 2. Representative effect of H2O2 0.2 mM on the ERG waves. Isolated rat retina was continuously perfused with a nutrient solution, and ERGs were recorded in response to white-light stimulation (0.025 lx.s scotopic, 1 ms). ERGs were recorded (a) before application of H2O2, (b) 6 min, (c) 12 min, and (d) 90 min following application of H2O2.
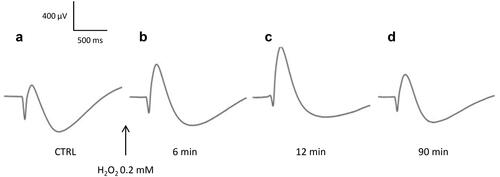
Figure 3. Effects of H2O2 on the evolution of the amplitudes and implicit times of the ERG waves. Isolated rat retinas were continuously perfused with a nutrient solution and ERGs were recorded every 3 min in response to white-light stimulation (0.025 lx.s scotopic, 1 ms). ERGs were measured in the absence (CTRL) or in the presence of H2O2 at concentrations of 0.2 mM (H 0.2), 0.3 mM (H 0.3) and 0.6 mM (H 0.6). A The survival curves represent (a) the evolution of the b-wave amplitudes (µV) versus time (min), (b) the evolution of the a-wave amplitudes (µV) versus time (min) and (c) the evolution of the slow PIII-wave amplitudes (µV) versus time (min). B The survival curves represent (a) the evolution of the b-wave implicit times (IT, ms) versus time (min), (b) the evolution of the a-wave implicit times (IT, ms) versus time (min) and (c) the evolution of the slow PIII-wave implicit times (IT, ms) versus time (min). Results are expressed in percentage relative to the initial value (100% of the wave amplitude or implicit time 6 min before injection). Each survival curve represents the average of at least four separate experiments. Dotted lines indicate the time of injection (t = 0 min), 6 min after injection of H2O2 (t = 6 min) and 72 min after injection of H2O2 (t = 72 min).
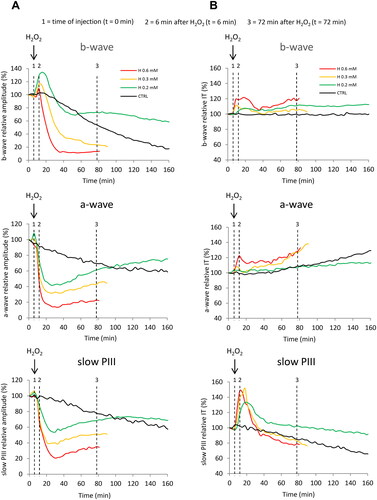
Figure 4. Mean values of the relative amplitudes and implicit times of the ERG-waves at the time of injection, and after 6 and 72 min of perfusion with H2O2. Isolated rat retinas were continuously perfused with a nutrient solution and ERGs were recorded in response to white-light stimulation (0.025 lx.s scotopic, 1 ms). ERGs were measured in the absence (CTRL) or in the presence of H2O2 at 0.2 mM (H 0.2), 0.3 mM (H 0.3) and 0.6 mM (H 0.6). Histograms represent the averaged values of (A) the amplitudes of the b-wave, the a-wave and the slow PIII, and (B) the implicit times of the b-wave, the a-wave and the slow PIII. Values were calculated at the time of injection (t = 0 min) and after 6 min (t = 6 min) and 72 min (t = 72 min) of perfusion with H2O2. Results are expressed in percentage relative to the initial value (100% of the wave amplitude or implicit time 6 min before injection). The data are presented as means ± SD (n ≥ 4 separate experiments). *p < 0.05, **p < 0.01, ***p < 0.001, #p < 0.05 and ###p < 0.001. ANOVA followed by Tukey’s posthoc test.
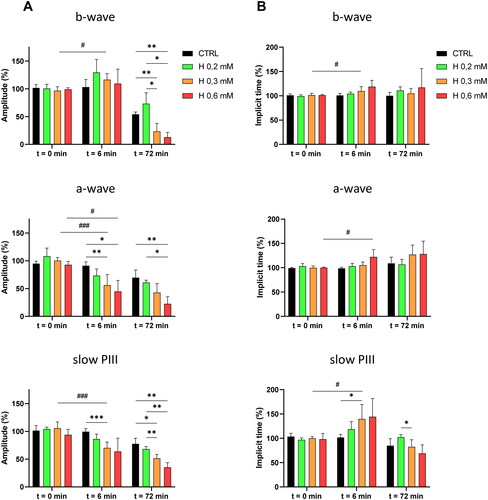
Figure 5. ERG responses in the presence of H2O2 after barium chloride application. Isolated rat retinas were continuously perfused with a nutrient solution and ERGs were recorded every 3 min in response to white-light stimulation (0.025 lx.s scotopic, 1 ms). Barium chloride (BaCl2, 1 mM) was added to the perfusion solution to suppress the slow PIII and to improve the b-wave. Hydrogen peroxide (H2O2, 0.3 mM) was then applied in the perfusion solution. A Representative ERGs recorded (a) before application of BaCl2 and H2O2, (b) after 6 min of perfusion with BaCl2, (c) after 36 min of perfusion with BaCl2, (d) 15 min following application of H2O2 after 51 min of perfusion with BaCl2, (e) 96 min following application of H2O2 after 132 min of perfusion with BaCl2. B Representative survival curves of (a) the a-wave amplitude, (b) the b-wave amplitude, (c) the a-wave implicit time and (d) the b-wave implicit time.
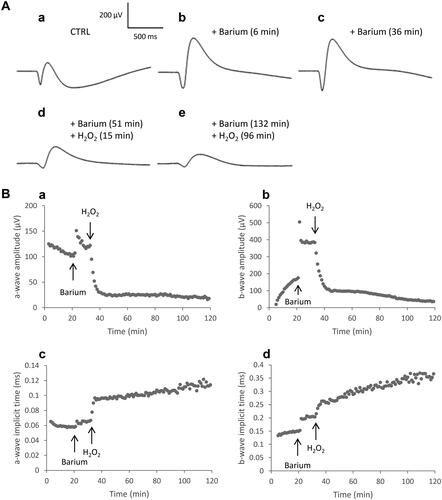
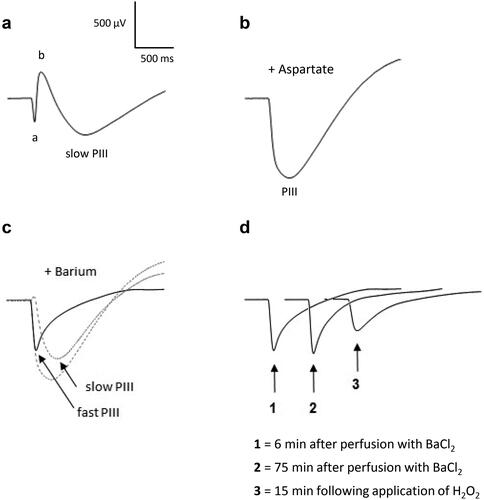
Figure 6. ERG responses in the presence of H2O2 after aspartate and barium chloride applications. Isolated rat retinas were continuously perfused with a nutrient solution and ERGs were recorded every 3 min in response to white-light stimulation (0.025 lx.s scotopic, 1 ms). Aspartate (Asp, 5 mM) and barium chloride (BaCl2, 1 mM), known to suppress the b-wave and the slow PIII respectively, were added to the perfusion solution to isolate the fast PIII component. Hydrogen peroxide (H2O2, 0.3 mM) was then applied in the perfusion solution. Representative ERGs recorded (a) before application of Asp, BaCl2 and H2O2, (b) after perfusion with Asp, (c) after perfusion with BaCl2 and Asp, (d) following application of H2O2 after perfusion with Asp and BaCl2. The smallest dotted line (slow PIII) in part c was calculated by subtracting the solid line (fast PIII) from the largest dotted line (PIII).
Data availability statement
The data that support the findings of this study are available from the corresponding author upon reasonable request.