
Figures & data
Figure 1. Standard curves for the detection of tear cytokines IL − 1β, IL-6, IL-8, and TNF − αusing cytometric bead array technology.
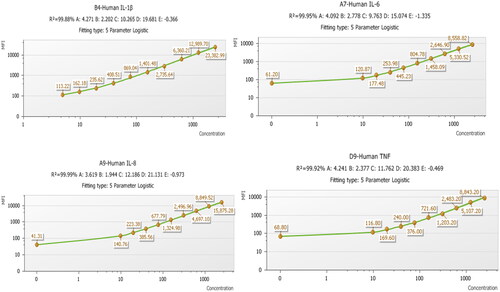
Figure 2. Bland–Altman plot for protein content of the two collection methods: the x-axis represents the mean protein content of the two methods, and the y-axis represents the density difference between the two methods. The mean difference between the two methods is 1.65 ng, with an upper limit of 13.956 ng and a lower limit of -10.656 ng. All data fall within the 95% confidence interval.
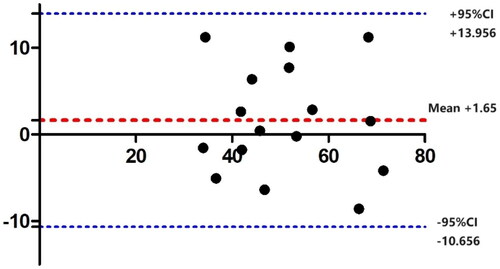
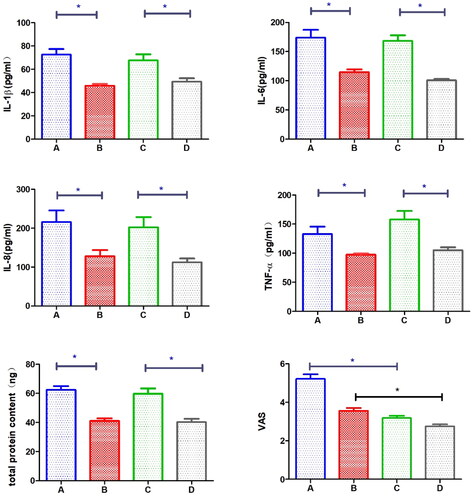
Figure 3. Indicator variations across groups and methods.
Group A: Dry eye, direct method. Group B: Control, direct method. Group C: Dry eye, diluted method. Group D: Control, diluted method. Note: ∗ indicates P < 0.05, denoting statistical significance.
Data availability statement
The data that support the findings of this study are available from the corresponding author, [Xinchang Wang], upon reasonable request.