
Figures & data
Table 1. Data set summary (number of observations).
Table 2. Evolution of polycentricity, 1990–2000 (number of MSAs).
Table 3. Evolution of polycentricity, 2000–2010 (number of MSAs).
Table 4. Evolution of polycentricity, 1990–2010 (number of MSAs).
Figure 1. Regional spatial autocorrelation of metropolitan employment centers, 2000.
Note: Color figures provided in the digital version available online.
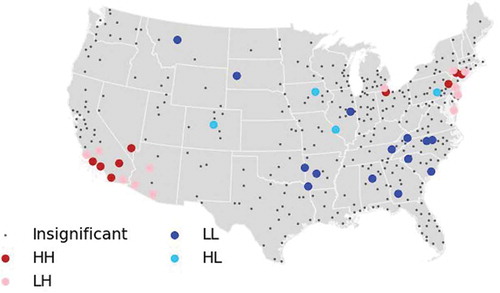
Figure 2. Change in employment centers, 2000–2010.
Note: Color figures provided in the digital version available online.
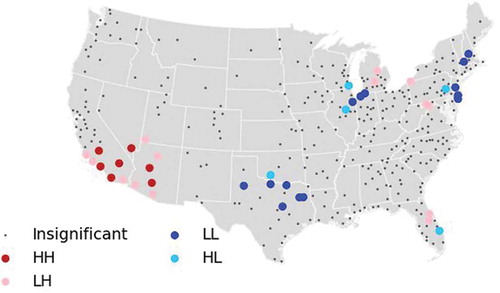
Table 5. Metropolitan population.
Table 6. Metropolitan employment density.
Table 7. Metropolitan per capita income.
Table 8. Metropolitan percentage of population below the poverty line.
Supplemental material